

Opening scene
This is an effort that has went on for a long long time, began as a side project (don’t they all?) and got bigger and longer, as I got more interested in the DEVOPS-originated observability platforms and as we were discussing more and more about them with my friend N.K. and other engineers in the NetAutoGr crowd (yeah we tend to do that between beers in our meetings..). After N.K.’s remarks on the last blog post, where he politely explained how I made his eyes and brain hurt with such a long text, I decided to spare him (and others) the trauma and try to write this in a series, consisting of multiple parts. Just mentioning him, so you know who to thank. So this is part 1, where I explain how all of this came to be, what is the scenario, who the main actors are and how they met in my set.
What happened to the other guy?
If you are wondering where my alter ego is, I haven’t seen him lately. He may pop up at any time, as he usually does. Like the Gods at ancient greek tragedy, descending from the ‘sky’ to provide solutions and exits, brought by machines and contraptions created by the theater companies (deus ex machina).
The scenery
Nagios: Historic reference
Nagios is a tool, a set of tools, a framework, a platoform, define it as you like. It was originally conceived as an ms-dos tool created back in 1996 by Ethan Galstad, rebuilt to run in Linux in 1998 and released in 1999, with the name Netsaint.
At that time I was doing my military service in the Greek Army. I had spent some time with Linux while still a student at the Mechanical Engineering School in NTUA (National Technical University of Athens) without a lot of success, trying to install Slackware for the first time, not very intuitive back then. I had spent some time in a small installation of SCO Unix, but I still didn’t understand a lot about it. By 1999, Mandrake Linux starts to make it’s appearance, a french originated distribution based in RedHat, much friendlier for installation and use. I was installing Mandrake side by side in my PC ever since, well into my Paris years at the ENST (École Nationale Supérieure des Telecommunications – now Telecom Paris), where I studied Network Conception and Architecture (a Master’s degree). I remember seeing NetSaint in the software list (Ethereal as well, which later eventually turned into Wireshark). But I never actually tried it or learned more about it. In 2001, I came out of the E.N.S.T., a C.A.R. (Conception et Architecture des Réseaux) graduate and more knowledgeable with Linux, but as a network engineer then, I didn’t have a use for it in the office, only at home.
In 2002, Ethan renames NetSaint to Nagios due to trademark issues. Nagios carries on, becoming POTM in SourceForge.net in June 2005, and starts getting traction in the community. Nagios Enterprises, LLC is founded in 2007, as Nagios continues to gain in popularity and awards as a “SysAdmin” and “Network Monitoring” tool. A historic reference can be found in the Nagios homepage and Wikipedia ofc.
The nature of Nagios: an SLM platform
Word has it that Ethan wanted to have Christmas with his family but was responsible of having to watch a number of systems to make sure they were up and working well, so he created this tool to do it for him and alert him if anything happened. And went on to have Christmas with his family.
I don’t know if it’s true or not. I often wondered about it, as with how come there’s a Greek origin in that name (‘agios’ – ‘άγιος’ means saint, so not random, but why choose Greek?). Whether it was true or not, I have often used that story as a selling point to spread the use of Nagios in my organization (yes, we are salesmen internally).
Little after 2007, I can’t exactly remember how far back this goes, I may be off by a year or two, I was running a couple of Network Monitoring platforms in my organization, which were making sure the Network was in good shape. But if those platforms were monitoring the network, what was monitoring the platforms? Nothing is the answer, and I would add no one, because checking every few hours if the disks are empty, how is the CPU and memory and other performance and operational parameters for the hosts (Linux and windows) and services (like the monitoring platforms for example, or SQL servers on the same machines, etc) is not really monitoring. It’s slavery. And also widely ineffective. However there are somehow still people trying to convince me that this is how they are monitoring their systems and services “successfully“.
So I looked around, found Nagios and started using it to monitor my own platforms and services with it (you will find some posts on this site). But the word got out somehow among my colleagues. A lot more had the same problems, mainly with system & OS resources, others with more complex needs. They came to me and asked and of course I said “hop on!”.
What started as a side monitoring project (the monitor of monitors) became a full-fledged Service Level Monitoring Platform ,carrying, after a few years, a clear and almost complete image of how half the Services and Platforms of the IT Department were doing at any given time. I went to great lengths to integrate more systems and services, using everything I could find to onboard more checks and ways to alert the other admin teams. But before I go into that lets mention a couple of things about its make and architecture.
Nagios Architecture
Nagios existed as a Linux software application, installable either as a package of the main Linux Distributions or compiled from source. It would run as system service eventually, after installation, using a main configuration file which you could break into many more additional files. That was a nice way to keep things easier to maintain, so I did that.
At the time I had gone into SUSE Linux (free version, not the SLES) and I initially installed the relevant distro package for Nagios. However, I soon discovered that it was not possible to do with that everything I wanted, unless I compiled from source.
So there was a config and a set of tools/commands that Nagios would run to perform the checks defined in the configs locally. There were “check commands” already defined with the main installation but you could add custom ones as you went along, either just wrapping already available executable files and software or after installing more libraries and programs to be used with Nagios.
If you wanted to run checks in remote systems (that was usually the idea, although there were things to run from the main one), there were two paths, depending on the operating system:
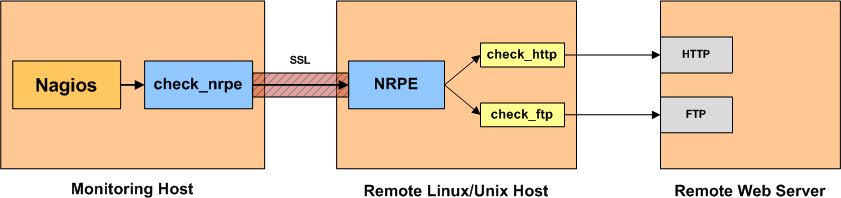
- if you wanted to monitor a Linux/Unix based system, you needed to install the NRPE server software at the remote system and use check_nrpe command in the main Nagios Server.
- if you wanted to monitor a Windows based system, you needed to install a windows application called NS-Client++ (there was another option but let’s not go there)
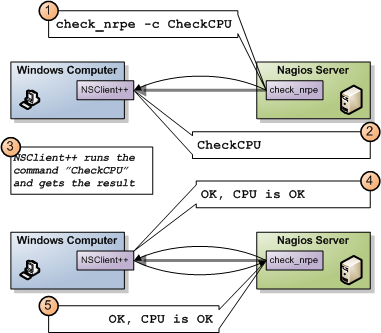
The flow would be as described by the diagram in the left. The server, would begin the check defined in the config, the NRPE client inside the server would send the command over to the remote machine’s NRPE server, who would then translate it to local checks, perform those and return the response in the opposite path. The response is usually comprised by a integer (status) and a string (message or metric)
Then, the Nagios Server would get those responses and store them in its local DB, available for “querying”. And I put that in quotes because although mostly in RRD format, it wasn’t very easy to “query” for that data..
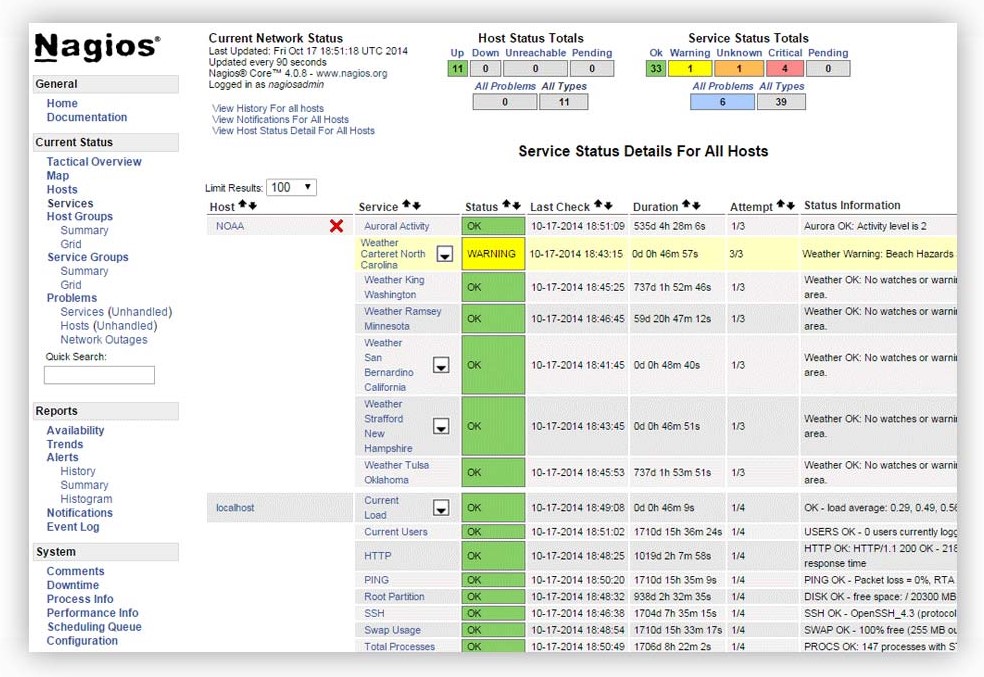
The Nagios Server would run a UI based on an Apache based virtual site (running in a path of the main Apache host) and would be based initially on CGI to produce pages dynamically and then on PHP but still maintaining some CGI parts. Basic (extremely basic) graphing for availability and trends reports was available but that sounds a lot better than how it actually looked and what info it provided for the period of interest.
Finally there was the alerting part. You could define users and user groups which would be named contacts if the checks you would define would fail. That meant of course any host or host group defined in the configuration, but also service checks, service groups (yes that was a thing as well) and custom checks (all you would ever want). The contacts would be alerted via email, so there was some configuration needed for Posftix (well there was a Sendmail option but why do that..), especially for using smpts (nightmare, I know because I did it). But it was possible (not out of the box) to do more stuff, like define http/https posts for sending an alert or even find a way to divert alerts to chat programs such as ms-teams (again let’s not go there, in IT anything is possible .. for a price, whether it’s about money, time, or eternal suffering).
What was especially good, was that the alerting and UI access could be distributed. By that I mean that a user team would only receive the alerts that were relevant for their systems and services (by defining them as contacts for those checks) and would only be able to see and manage those in the Nagios UI (that mapping and filtering was taken care of by Nagios). That was a big deal as it could take a load off the Nagios admins that didn’t have to receive all of the alerts generated for the different teams.
Some grouping was possible in the configs. But as exceptions were needed for what threshold was good for which team and group of systems and which services were actually present on which platforms, the necessary configs became very long and there was a lot of duplicated text (with just the right differences).
Finally, it’s important to note (again) that the data was not really querible externally. Nagios did not offer a DB access interface (API or other type). It was just data points stored in files (RRD format).
Eventually Nagios Enterprise produced an Enterprise version of the product, called Nagios XI, providing an improved UI and some reporting capabilities. I tried it for a small period but the support for external platforms was way behind and the benefit seemed minimal for the cost, plus there was no easy way to integrate everything I had already put in the free version, so I let it go.
Since the Nagios XI had been made available, the free version was branded as Nagios Core. It has lately been made available as an Vmware OVF template, so you can deploy it ‘painlessly‘ in a Vmware platform but it’s essentially the same deal with the package version, you don’t get everything you might have wanted. Again I passed, I had long since concluded about what was possible to do about the platform’s many problems. Time to tell you about how deep the rabbit hole went.
Dive ! – How deep? Problems?
I went pretty deep in that long year period. I integrated SNMP checks, Cisco IPSLA, Vmware VCenter checks using first the Perl SDK and then the Python one, custom software on HPUX and Solaris, you name it. We also added LDAP and then LDAPS support for user authentication, https for the UI, encryption for the communication between server and agents, similarly encrypted coms with the mail servers, alerting via SMS providers, http/https content checks. I eventually went on to write my own plugins on many occasions, using mainly python scripts with system and network automation.
At the same time, everything added or integrated needed to be prepared for the compile from source installation. If there was a change in the supported libraries things could break. If I needed to upgrade things on the OS or elsewhere, things could break. A CVE would come out for Apache (oh my god Apache!! I am so glad to be rid of it, along with all the mod stuff..), while moving to a new version, things could break. There was no end of it.
For providing graphs, I had installed Nagios Graph, which came as a separate application, reading from Nagios RRD performance data and producing graphs dynamically created and available through action based links in the Nagios UI. That was another nightmare to keep updated and working (and authenticate access, and.. ).
Remember that I am a network engineer. Imagine me trying to maintain a platform that was supposed to make my life easier, and having to spend days or even weeks sometimes, compiling and rebuilding things from scratch if they didn’t work or had suddenly stopped working. At some point I had been learning about Automation and Ansible and tried that to gain some time (I even blogged about it on this site) but even then, there was compiling running under the hood, I had to run things manually a couple of times and monitor the results and then integrated them in Ansible playbooks.
When I learned about docker and docker compose, I started looking at ways I could perhaps run Nagios on Docker. But that wouldn’t really fix things. I found a couple of nice attempts, the original one by Jason Rivers and one made by a greek (Christos Manios) as a port of the original but much richer. Again, they either had too much on one field or too little on another and needed manual tweaking of the dockerfiles, while keeping the main components such as Apache.
At some point, as I was using PyATS (yes, I wrote a Nagios plugin that used PyATS too, to check OSPF configs on Nexus Datacenter Switches), I had envisioned using Nagios to monitor everything as a state. So why not the network? I said, if the network is doing fine, then everything is green. If there’s a problem, then something is Red (so alert). And PyATS could run network tests, it was made for it. It seemed like a cool idea. But I eventually grew out of it (and PyATS as well I guess, but that’s another story. I still think that team is absolutely amazing and that they have been treated unfairly by Cisco).
As time passed, Nagios had become critical for my organization (as usual not everyone thought so though or cooperated with allowing access to monitoring their resources). The checks for the Website were in there, checks for financial platform status and connectivity (not just by me, that was an enormous effort by a colleague but of course I can share none of it), a lot of systems and services. It had actually served as the final check when doing a systems and platforms check during the final phase of a big datacenter network migration and it was the tool that alerted us that something had actually gone wrong and was still wrong, before we had to haul the migration team back to the site to keep working on a fix. So it was kind of serious.
Actual problems that could no longer be ignored
Nagios is an aging project. It’s built on c/c++. It’s very slow to develop and update and in my opinion can no longer keep up with the global IT enterprise environment. Besides that, I hate compiling C. Perhaps I could live with C++, but that’s not my project and it’s a huge one. I can’t compile again and again, every time I have to upgrade something and something else breaks. Keeping everything installed in the same environment was the main reason for these problems.
The platform for the UI is also a big problem. Apache is heavy and difficult, integrations are a big problem and not always compatible with the rest of the system and installed software.
The UI itself is not ideal. Very basic, not inviting users into actually engaging with it (I can attest to that). Also it’s based on PHP (and partly on CGI still as well), again a security and maintenance problem.
As a result, maintenance was hell. I deployed git to help with version control for the configs, but that was it.
In the latest years of my career so far, when I have to setup and maintain a tool at the present time, I take great care in running it using IaC platforms. For one thing, it gains me a lot of time and provides a big margin for error and research. Secondly it provides independence (sort of) and separation from the OS. And as a third benefit, it’s always ready to move to a bigger environment if my organization switches its model to how software and apps are run and maintained. Nagios failed in all that. It should have been previewed by the dev team and there should have been a reaction by the company, but perhaps there are not enough resources for it.
Coming up for air
I had had enough. I went up to the point where I tried customizing dockerized installs of Nagios. And then stopped. I left the platform being maintained as little as possible, while I shifted my time and efforts towards more promising paths. The final version of the OS used was Ubuntu 20.04 LTS and Nagios Core 4.4.3 on top of it. I had also stopped using Nagios Graph or the SNMP integrations. The last victim to go was the VCenter checks, as again we hit a wall in some library conflict, due to the OS version and what was supported. I urgently needed a different solution.

The scenario twist
In a story, there are sometimes twists in the scenario. In our case, a tragedy, the village of IT farmers needs protection and hires a hero to carry out the task, but that hero runs into problems and falls. Usually the twist involves the introduction of one or more new actors in the story, or actors that develop as characters in a parallel story and are moved into the main plot. In this case, the new actors were Grafana, from Grafana Labs for the UI, and Prometheus for the checks and storing the data.

Grafana
What is Grafana? Here is Gemini’s summary: Grafana is an open-source observability platform used to query, visualize, alert on, and explore metrics, logs, and traces from various data sources, such as time-series databases, cloud platforms, and databases. It allows users to build customizable and interactive dashboards with a wide range of visualizations, including graphs, tables, and heatmaps. Grafana also supports alerting on data, user management, and provides a framework for building dashboards with data from many different sources without data migration.
I am going to cut Gemini’s summary short here. We don’t have that kind of space and time, and you can look it up on your own. I included above the first part of Grafana’s documentary for the Story of Grafana, published on the occasion of its 10 years anniversary. You can also read up on its history, here.
What’s my take? It’s a God sent. It’s my UI of choice for everything monitoring. It’s probably everything you wanted for a UI for visualizing data (all kinds of data), extremely extendable with a lot of integrations and plugins, supporting a wide range of data sources, very performant, very scalable and supporting Infrastructure as Code, as it was built on Go from the DEVOPS world of things and brought over to be used in other contexts by people like us, network engineers, looking for performance monitoring tools. It also supports a great deal of other important features in its community/OSS version (there is also an enterprise version, on premise or cloud):
- LDAP / AD support for access in the UI
- Basic access rights scheme based on folders (RBAC only available on Enterprise)
- User teams supported
- Native support for alerting via email (MS-Exchange too)/ MS-Teams (plus more)
- Support for APIs
- Support for IaC – installation also available on Docker and Kubernetes
I started using Grafana to replace MRTG (blog post here, here and here), then moved on to use it for Network Latency Monitoring (no blog post on that), and finally for monitoring Logs with Grafana Loki, both for network devices but also for my Linux Servers (blog post here). First version I used was 5.6 I think. I am now running 12.1.1 in the most recent instances and still have some on version 9.6, soon to be replaced (I finally have the way to go fast).
Grafana was a great replacement for managing users, access and displaying data. But I had missing parts there. Who would gather the data (and how) and would provide the data source for Grafana? And most importantly how could the state of things be represented in Grafana? I will get back to that as it deserves more attention and comment.
Prometheus
Prometheus. The demi-god that brought the fire to humans.. Fitting name for it. It’s a CNCF managed project, with a great history behind it and a cool documentary about its origin. Let’s see what summary Gemini can come up with:
Prometheus is an open-source systems monitoring and alerting toolkit used to collect and store time-series data. It operates by using a pull-based model to collect metrics, storing them in a time-series database and making them available for querying and graphing with its query language, PromQL. It is a popular tool for cloud-native architectures and is part of the CNCF ecosystem.
Again cutting the summary short. Here is the documentary website for the story of the Prometheus project. And the video for the documentary is included below.
So what’s my take for Prometheus? I really had none at first. My first meeting with Prometheus was in training labs or projects for Streaming Telemetry or implementations for SNMP Monitoring with Telegraf and Grafana, in place of InfluxDB. I thought, well, it’s another Time Series DB, perhaps a nice option and more open than InfluxDB, but since I was already using Telegraf, it felt better to use a DB that came from the same software source, Influx Data. That of course was before the InfluxDB v.2.0 drama, which made a lot of network engineers ditch InfluxDB and either switch to Prometheus or different components that seemed to do a better job at that (I still haven’t tried Influxdb v.3.x, I got some work to do on that).
As I researched on what tool I could use for observability, I stumbled upon Prometheus more and more. The support for integrations using exporters was impressive (there was even a Nagios exporter in case I wanted to migrate the data visualization before completely wiping out my Nagios instance). Also I have to credit N.K. that suggested I use it, time and time again, during our interactions with our NetAutoGr group. Of course I could have used Telefraf to do nagios checks and then store that to InfluxDB, which I already knew how to operate (iQL with InfluxDB v1.x and Flux with InfluxDB v.2x plus python SDKs). But what would be the point of maintaining even the slightest part of Nagios Infrastructure alive (the ‘agents’ in this case).

Understanding Prometheus Architecture, setting it up and discovering what to do for integrations or how I would add custom solutions to the mix, was one thing. But my real issue was with another.
A shift in mentality – the real twist
As in the movie, the new actors come to provide strength to the villagers. But the real twist comes when the original protagonists find what is needed, and change comes from within.
This is not far from what had to happen in this case. I was so much into how Nagios worked that I couldn’t see anything else. I thought, Nagios responds OK, Error, Warning or Unknown (logical states). How does Prometheus respond to a promQL alert query? With 1 and 0? Then how can I map that to what I am doing now?
Someone (yes it was N.K.) had to actually tell me that it was fine to take 0 for ‘ok’ and 1 for ‘not ok’ (yes I know it sounds ridiculous but that’s what happened). Obviously there are no other alert states with Prometheus, you either get an alert or everything is ok, but you could have other alerts if you like with different thresholds and messages.
I just accepted that and moved forward in what I considered to be the right direction. But it wasn’t until very recently, almost after half the migration was over, that I remembered that Nagios also sent integers back when checks are run with plugins and that those were mapped to states in the backend (exactly what happens here as well). It was stupid of me not to see this from the beginning. Just goes to show how we entrap ourselves with our mentality, missing the obvious, right in front of us. Is it stress related? Is it something deep? Probably. But there’s the opportunity to free your mind and celebrate instead of beating yourself up over it. And on we go.
Onward and Upward
Once I figured that out (even with help), it all changed. I studied and found out how I could map values with states, colors and more in Grafana. Slowly the visualization part seemed to be doing great, with the help of Prometheus. To understand more, I started looking for training resources for Prometheus. First video I watched was from Nana:
I also found some Udemy courses (so I bought a couple) and a very good course in Pluralsight (which I use regularly as a platform), but I will not promote either the platforms or the courses & creators here. There’s also an O’Reilly book from the ‘Up and Running’ Series, and more resources (I have also watched one of their live trainings).
How Prometheus works
Essentially this is how:
- Prometheus defines a set of targets in its config and periodically “scrapes” data from them which comes in a specific format. It then stores the data in its TSDB (Time Series Data Base) where it waits to be queried (for example, by a visualization platform like Grafana or Prometheus itself with alert rules).
- Those target are running services called ‘exporters’, which expose metrics data in Prometheus format, using http/https. So they are basically running a simplified website, consisting of only one page in a specific path (usually /metrics). You usually need to install exporters in the target systems.
- If you can’t run an exporter on the remote system you can run an exporter locally on the Prometheus system or a different dedicated system and run a client for your service there, which then exposes the metrics (the Vmware VCenter and the Black Box exporters work that way).
- If you want to have some custom metrics you have two options:
- Use an exporter that covers a more generic set of metrics and use a file source to enrich it (we used such a case for adding custom financial platform data to a node exporter)
- Use scripts or other means that ‘push’ data to a ‘Push Gateway‘. That then serves as an exporter to Prometheus which goes to scrape that instead
Alerting
Alerting happens through a separate instance called Alert Manager. Believe it or not, Alert Manager does not define alert rules. Alert rules are defined as part of the Prometheus config (usually separate file). What Alert Manager does define, is Alert Routes. And that means a set of matching rules that define how an alert would be ‘routed’ by matching one of the conditions defined in the Alert Manager configuration.
The destinations in Alert Manager routes can be email addresses, or ms-teams channels (that takes a little bit of work actually) and more, provided you configure Alert Manager to be able to send those alerts down that road (for example to an MS-Exchange server).
The real magic of Prometheus – Labels (like tags??)
Some would say it’s the service discovery thing, this or that. For me it’s Labels. Labels are like arbitrary variables, like tags, that you can define in Prometheus to accompany the data so you can perform your queries either for monitoring states, or producing Graphs or even for writing alert rules so that you can define when something is behaving normally or not. There are multiple kinds of labels in Prometheus but I won’t get into that. Let’s just say that labels are critical to setting up your monitoring platform the way you want it to be. Examples of labels would be the ‘instance’ (essentially the hostname along with the exporter tcp port), or environment (‘prod’,’test’,’uat’, etc) or ‘team’ (arbitrary name, in our case depicting which admin team the data belongs to). At this point I will just mention that labels are also in the heart of other tools like Telegraf and InfluxDB, and you will often find that notion inside Observability Tooling, and of course, they are supported by Grafana! But we ‘ll leave that aside for now..
So main config, targets/jobs, labels, metrics, queries, graphs, alerts. Most people would be ok with this setup. But not us.
Why this is not enough
Well.. so many reasons really. Let’s try to make a list:
- Prometheus doesn’t support LDAP/AD authentication. It only supports basic authentication which is not enough in our case.
- Prometheus dashboards are very basic. If you really want better dashboards and panels, Grafana is a must. So you need both platforms at least for visualization.
- If you follow Prometheus basic architecture, alerting happens through Alert Manager. Using Alert Manager for alerts, you get Prometheus and Alert Manager links in your alert messages (through alert rule definitions and annotations), so if you click on the link you don’t get the nice Grafana Dashboard you expected to see. The two platforms divert there.
- Alert Manager doesn’t support MS-Teams. You can find an additional app, also available as a container, but it only supports one URL, it doesn’t scale with multiple team channels webhook URLs (although there was an option about using dynamic URLs passed down by the config but it didn’t solve my main issues).
- Trying to use Infrastructure as Code with Prometheus, your capabilities are very limited. At least you can define config in text, which means you can use git to do version control, but if you thought you could use APIs and IaC tools at scale, think again.
Let’s face it. Prometheus was not built to serve as an Enterprise Monitoring and Alerting Platform with all the commercial bells and whistles. It’s a CNFC graduate & no bullshit Data/Metrics collecting platform that is extremely extensible, very scalable, can fit in any larger architecture that covers all that but is in no position to fit all the necessary roles at once in this environment. This is by design.
Searching for the missing link
When I started looking for another alerting solution, I had already realized that I needed to built my platform around labels. To keep the distributed alerting nature of my Nagios Core instance, where the admin teams were alerted about their own systems and services and had access to nothing else, I needed a team label to determine the access they had to data, but also to be used to route their alerts correctly. Doing this with the Alert Manager to define who gets what, was easy. But I couldn’t link that without a lot of additional pain to Grafana, instead of the Prometheus/Alert Manager duo (you could get away with some stuff using annotations I guess.. maybe.. maybe not) plus I couldn’t send alerts to ms-teams channels. At that time, support for IaC was important but I had not gotten there yet.
So I started looking for an alternative solution to alerting than the Prometheus Alert Manager. It was on Cisco Live 2023 I think that I asked Christian Adel who was had just finished a presentation in the Devnet Zone about a similar subject, along with his then colleague at Network to Code David Flores. Btw, Christian and David are among the authors of the excellent book “Modern Network Obsevability” by OReilly, with the third author being Josh Vanderaa. You can find more info on that both on Eric’s Chou podcast Network Automation Nerds, episode NAN079 (included above), but also on Devnet NetGRU (Adrian Iliesiu), here and here.
So Christian suggested I check Alerta. And I did. It kind of worked. What I wanted was to route alerts from Prometheus to Alerta with the relevant labels and then define define different contact points, where Alerta would in-turn route alerts, both for email and ms-teams. When that alert was received, I wanted the user to be able to log inside Alerta using LDAP/AD and look at the alert generated. As soon as I ran into problems and tried finding support so I could find a solution, I realized the project was essentially dead. The project author had abandoned it. Of course some time had elapsed since Christian suggested it and me trying to use it (more than half a year perhaps). But that was that.
While posting questions in the Alerta slack, I was approached by the founder of another project, Keep. Keep’s founder assured me that the Alerta author was ok with them picking up Alerta’s ‘customers‘ (but I wasn’t looking to be anyone’s customer) and we did open a discussion, even went through a small web call. However I realized that Keep was still early in its deployments and the features I would require were either not free or had to be developed for us, with perhaps the promise of a subscription later. It wasn’t what I was looking for. As I later found out, Keep has been acquired by Elastic, so maybe that was for the best.
Grafana catches up
In the mean time, Grafana, ever since version 9.x, had made available as an option the Unified Alerting scheme. With legacy alerting you would need to tie an alert to a specific panel in a dashboard (like a time series), specify the alert there and perhaps get some additional benefit such as annotations on the graph series when an alert was fired and when it was resolved, etc.
However that kind of alerting was not at all scalable. I was using it for specific cases (for example CPU and memory monitoring of Checkpoint Firewalls – yeah the same ones where I was monitoring the VPN users for.. Thank God that’s over..).
With unified alerting Grafana alerts were defined separately, like you would do with Alert Manager for Prometheus. However at that point in time, I was very much confused with that change, even though I migrated those alerts I did have with the old scheme and left it at that.
When I started looking into how I would be able to get alerting working for my SLM solution with Prometheus, I didn’t think of Grafana at all at first. As it turns out, Grafana had eventually evolved their internal alerting system into a fully fledged Alert Manager (the very same one) but acting as an internal instance inside Grafana. This does make things easier and does scale, but at that moment I still had no idea.
When I became aware that Grafana could perhaps help with alerting, I looked into whether I could actually route alerts towards Grafana, the same way I was researching routing alerts towards Alerta or Keep. That didn’t work. At this point I need to clarify something. Like I said, alert rules can be defined inside the Prometheus configuration (not the Alert Manager configuration, where you define how alerts are routed and the relevant contact points). If you do that, and define a Prometheus datasource inside Grafana, then Grafana can “see” those alert rules, and displays them as “Data Source – managed“.
When I first saw that I was thrilled! Then I somehow discovered that you could also define an alert manager as a datasource and that could help display the alerts state in Grafana! Yey!!!
Well.. in fact.. not yey.. not yey at all. While that’s possible, and you can certainly view the alerts there (I didn’t get to research if you could modify links to point to that place in Grafana instead of the external alert manager pages), the alerts you can see there in this way are essentially in ‘read-only’ mode, as they are read from Alert Manager (the only place where you can actually interact with them, create silences etc). As I wanted to have control over which team would be able to see which alert and create their own silences, that didn’t work for me. Because among other things, as you can probably guess, Alert Manager, much like Prometheus, also doesn’t support LDAP/AD based authentication..
Not exactly Occam’s razor, but close
The simplest solution is often the correct one. In my case, again, I could not see what was in front of me. Instead of looking for an additional node to handle the alerting, I actually needed to remove one. When Grafana v.11.0 came out, legacy alerting was removed and a new redesigned alert rule detail view was introduced:
- https://grafana.com/docs/grafana/latest/whatsnew/whats-new-in-v11-0/
- https://grafana.com/docs/grafana/latest/breaking-changes/breaking-changes-v11-0/
So the answer was that Grafana could now define and handle alerts entirely on its own with the new integrated Alert Manager. In fact it was available in version 9 as the default alerting method, which could be tweaked through the grafana.ini settings file. But with version 11, it was the only method available. So what was I to do with the external Alert Manager and the rules defined there?
Well, I had to move them to Grafana and remove them from Alert Manager. In fact in this case, the external manager does not need to run at all. Now that I think of it, I should probably go remove it from my instances, it’s still there, doing nothing..
Everything falls into place.. almost
So Grafana would be responsible for both visualization and alerts, which would be created the same way as with Alert Manager:
- proper alert rules defined as promQL queries,
- routed via notification policies where the ‘team’ label value would be matched to the values defined for that label in the Prometheus targets definitions.
- for each target a ‘team’ label had to be defined at least in Prometheus at the target definition level, so that the alert routing could take place in Grafana (I already knew it had to be done that way since I was researching it for Alerta or other tools).
- MS-teams alert messaging was very easy to use by defining different webhook URLs for each contact point
There was still some research work to be done with message templates but I wasn’t yet aware of it at that point.
Targets and Exporters
And what kind of targets and exporters would we be looking at? I had to cover everything my Nagios instance had been covering. Well, first the OS stuff:
Processes and Services for windows were covered via the Windows Exporter. For Linux systems though, if one wants more detailed data, you also need:
For Vmware VCenter, we would need the
- Vmware Exporter – Heads Up: This is no longer maintained due to the Broadcom bullshit but I am hopeful. Works just fine until now, even with dedicated role assigned in VCenter.
For checks about ICMP (reachability), DNS and HTTP/HTTPS (covering both web content checks but also REST API paths), we would need the
There were cases where the node exporter was expanded in some systems using files as input, with the files being fed through scripts and the metrics being strictly defined with similar means. Unfortunately for the community, all this concerns deploying metrics to monitor a payment provider infrastructure so I can’t share any of it (strictly confidential). All I can tell you is that I didn’t create those, my colleague I.Z. did and they were first deployed on a test Grafana/Prometheus instance on Kubernetes built by my other colleague G.K., before being ‘migrated’ (the target definitions, the alert rules, the notification policies and the dashboards were just recreated elsewhere, it still works there, it’s just another viewpoint for the same data – and well, another DB, to be totally honest) on my production instance on docker, deployed and managed with docker compose.
Also, we on-boarded the metrics from a Springboot application that produced Prometheus metrics on its own metrics path, independent of system based exporters (no installation was done, it only needed configuration). That’s a different category of targets that happens to already exist in applications all around (all this came from the DEVOPS world, remember?) and it’s also possible to have custom made applications expose Prometheus metrics via specific libraries available for programming languages. I have also learned that there is a Prometheus metrics endpoint for Nautobot that I can use to monitor the instance and its metrics, which seems very interesting as a possibility (different project, soon).
There’s so much you can do with data, here is the list of exporters currently registered with Prometheus. Perhaps you can come up with your own ideas for your environment.
Encrypted communication and authentication between Prometheus and targets.
There are always security concerns. And there should also always be a sensible and golden compromise between insane security and practicality, between strict compliance and operations. In this case, even if it wasn’t our first priority we did research how it’s possible to provide encrypted communication between Prometheus and the defined targets, as well as provide a basic authentication for Prometheus at the targets. I.Z. researched and tested that and I provided the finishing touches (really just a touch).
What you need to do is make sure your target exposes metrics using https instead of http. To do that, a trusted certificate needs to be used. In our case, we are using our own corporate CA so we also need the CA certificate to be declared in the Prometheus config for the target (and mounted inside the Prometheus container) in order for the target certificate to be trusted. That (along with the right config lines) makes sure that:
- the target uses https to expose the metrics
- Prometheus uses https to scrape the metrics and trusts the target certificate
That takes care of the encryption part. A small additional configuration part at both sides takes care of the basic authentication. The secret can be stored in a hash in the config (I keep forgetting whether it’s stored in plain text at one of the two sides or not.. I will make sure soon and come back to edit this, but it will also be made clear when I present the configs at following post – part 2,3,4, who knows, don’t worry, I won’t stop until it’s done). Btw, I.Z. told me he didn’t find much documentation for that, I will do my best when I write it up as well, maybe there’s still something to be found but at least you ‘ll have the examples in this article.
Dashsboards for everyone (with Permissions – keyword: Folders)
If we have the distributed alerting covered, then the visualization also needed to be covered for everyone. This was a big plus for Grafana, which was much more impressive and versatile than Nagios Graph, and perhaps its’ stronger and most well known features, where one can literally design any kind of dashboard with different kinds of panels, define variables to be set through drop down lists, transform data and provide colorization, annotations, etc. I am not an expert in the field but I have got a good taste of what is possible in general.
In this case, except for the migration of the dashboards already created in the kubernetes based test instance, all the rest was carte blanche. It was very easy to lookup dashboards from the Grafana website’s dashboard library, locate the ones what had Prometheus as a source and download them into the instance by just providing the ID number for the dashboard. Once that is done, one has to define what the data-source is and if you are lucky enough, it just works ‘out of the box’. With a little experience on how dashboard variables work and how label values can be retrieved from data, it’s easy enough to fix discrepancies and adjust the variables definitions and dependencies.
In the end, I created/modified/updated these basic dashboards:
- One for Windows Servers based on the windows exporter
- One for Linux/Unix Servers based on the node exporter
- One for Springboot metrics taken from the application metrics endpoint
- One for http/https metrics based on the Blackbox Exporter
- One for icmp metrics based on Blackbox Exporter
Those last two have not yet been made available to the admin teams, but will be made available soon. I also included a standard alerts dashboard for the admin teams to be able to monitor their active alerts through there as well.
So with that, we had also taken care of the visualization for the SLM platform on anything already defined as interesting monitoring information. But what about the distributed nature of the information and making sure that each team was restricted to the dashboards and alert handling for their team only?
You shall not pass!!
Grafana has the capability to define access rights per teams or users. By putting all users in specific teams and defining access rights per user you can define ‘who‘ gets access. Defining the ‘where‘, is done using folders. You define a folder hierarchy, which assigns a folder under root to each team. Under there you can further split stuff like different folder for different kind of dashboards and a different folder for the alerts (keep that in mind, I am getting back to it). Sub-folders inherit their permissions from parent folders, so defining the access level for the team, only needs to be done on the parent folder.
When it comes to alerts, there are more things to keep in mind that tie in the folder structure. Alert Rules are defined in Alert Rule Groups which essentially group together evaluation behavior for the rule in that folder, as evaluation groups are tied to specific folders. How often the alert rule is evaluated, what is the pending period etc, are defined in the alert rule groups/evaluation groups so those values are tied to a specific folder. I chose to assign a specific sub-folder under the team parent folder to keep their alert rule groups there (it’s a one to many relationship between folder/rule group). What I gained there is also the access rights for the admin team.
In this scheme, I can offer an admin team editor level access on their own folders (which means for their dashboards and rules), while keeping them at viewer level at the organization. In the same way I don’t even give any access rights to admin teams for other admin teams folders. In that way, they can’t see the other teams dashboards or alert groups and they can’t affect them. It offers a sense of isolation and distributed handling for both the alerts and the visualization and that is exactly what I was going for. Except one thing..
Silence!!
You can’t silence alerts through the silence menus in Grafana OSS, unless you are an organization level editor. Since those admin teams are defined as viewer level in the organization, that means effectively they can’t silence their own alerts.. at least not through the silence menus or the links included in the alert emails (or ms-teams alert messages), as those are targeted against the silence endpoint. You can only make that adjustment in Grafana Enterprise, with RBAC (Roled Based Access Control) which is a lot more granular. That’s a business choice from Grafana Labs, and I can’t blame them (although it did give me grief for a quite a while). But I did find a workaround.. Sort of..
What you can do in this scheme is use the alert rule interface (by viewing the specific alert, defined in the admin team’s folder so editable) and use the silence link through the ‘More’ option. If you are careful enough to include the label filters you need in the page that appears, and check below which instances are affected by the silence (Grafana Labs is nice enough that, so you get a chance to check what you are doing before you create the silence). Once you have already created the silence I am not sure if you can alter it or unsilence the alert, but at least that’s a way that keeps the control with the admin team. In our implementation there will be an entity with Editor level access in the organization, an operators group so I guess there’s that as well.
So Distributed Alert & Handling, Visualization, access rights, all kinds of targets covered, I should be happy right? Well.. one thing was missing.
The final twist: IaC – a hero or a villain?
Sometime before putting the final touch on how everything should be done to cover all of the above, I realized of course that my initial thought of provisioning dashboards with yaml files and json and rest apis, was a bit optimistic with the complexity of this construct. While reading and checking however I found out that there was an excellent option out there: An official Grafana Terraform Provider!!
What is Terraform? Here is what Gemini says:
Terraform is an open-source Infrastructure as Code (IaC) tool by HashiCorp that allows you to define, provision, and manage cloud and on-premises infrastructure using human-readable configuration files. It enables the automation of infrastructure tasks by describing the desired state of resources, which Terraform then creates and maintains using providers to interact with various APIs. This approach offers benefits like safety, efficiency, reusability, and cross-provider compatibility for managing complex IT stacks.
In this case, Terraform handles what you want to provision automatically with Grafana, by issuing a lot of REST API calls, while at the same time maintaining state. Grafana handles all that with much grace, visualizing what resource is provisioned (with Terraform), separating those from the rest. It certainly doesn’t feel like a bolt-on solution, but that Grafana is aware of it and is taking it into account in the way the UI responds to the user about it (for example if you create a copy in the UI of an alert rule that has been provisioned, it will warn you that this rule will not be included in the provisioning scheme). The speed at which all this happens, is amazing. And believe me, I have spend some time copying and editing dashboards, so I can appreciate that.
As it turns out, not only does such an official Terraform provider exist, but it covers both enterprise and OSS instances, both on premise and in the Cloud but there’s also a somewhat decent documentation for it! I decided to give that a go.
My first contact with Terraform was hearing about it from several people, my friend at Devnet and now Learn with Cisco, Quinn Snyder, being one of them. I had participated in a training with Sean P. Kane (like “Terraform Fundamentals” etc), I am also aware of Ned Bellavance’s training material on Pluralsight and the “Terraform up and running” O’Reilly book by Yevgeniy Brikman (also strong supporter of the OpenTofu fork). The problem is I could not really connect with what I was watching as it mostly happened in the cloud and I had no dealings or use cases with AWS to be able to fully grasp what I am doing.
When it comes to networking, there are of course a lot of efforts on record to bring Terraform in network automation as well, whether it’s the valiant efforts of Story DeWeese, or attempts to do it from scratch for various network vendors in automation projects like the one presented in Autocon3 “Automating Networks with Terraform” with Eduardo Pozo (see video above).
My own understanding of Terraform changed when in February 2025 I attended a lab while at Cisco Live for using Terraform for Cisco ACI, by Thomas Renzy. That I understood completely.
“I rarely test something, but when I do, I do it in Production!”
Well that’s a joke from my PyATS days, but there’s some truth to it, especially in this case. Since the Cisco Live experience with Terraform, I was itching to try it with something I could get my hands on. So when I found out I could experiment with Grafana, I was thrilled! At first I wasn’t counting on using it for production. But it soon became apparent how straightforward it was, although I did fall through a few pitfalls with it. For example, deleting all the users from your organization for one thing.
I did manage to use Terraform with Grafana for provisioning almost everything in this project, and soon found out there is sometimes an order to do things, but you can potentially work around it. Here is what I did manage to provision with Terraform:
- datasources
- users
- teams
- contact points
- folders
- folder permissions
- dashboards
- alert rule groups and alerts
- notification policies
- time intervals (or mute timings as they were called)
- and last but not least, message templates.
What I didn’t get to deploy with Terraform, as there is no way to do that in the provider, is Silences. But I figured that this was the last thing you may want to provision with such a tool, as it can be very interactive for users, not the Grafana admins. A silence usually comes from an alerted user, who will handle the alert and will silence it as a way to acknowledge it providing comment that other members can see, but also a way to stop it from bothering more people while it is being handled. So what’s the reasoning to apply IaC there? Perhaps that was also why they probably skipped it. I think it’s still available through the Grafana REST API though.
All of the above helped me also to put everything in version control, as it was all text files (.yaml files, .json files, .tf files). So Git for version control, remote git server (inhouse gitlab) for sync, replication on the disaster and test environments and instant provisioning through Terraform. Not bad, right?
It all takes some practice and research and reading and a lot of testing. Sometimes it helps when you have a loyal lab rat to help you with all that.
The GPT Lab Rat
I have to mention it, when trying to research stuff at limited time and lightning speed, the various AI can be a lot of help. And I did put it to the test (ChatGPT 4 and 5). You have to be aware though that it does mess up a lot. It hallucinates a lot, it will send you down rabbit holes that you would probably not spend time in if you did the research yourself (and you do end up doing that eventually in those cases) but you learn very fast and you do get a chance to deploy things quickly. Things which you, by then, learn exactly how they work and can develop more on that on your own.
But you must be careful. Otherwise, if you were intended to run head first into a brick wall and are bent on using AI with everything, it will certainly help you get there with blazing speed. Good luck with that.
In my case, I certainly learned a whole lot and I am now confident I can apply IaC with Terraform on my other Grafana instances and use that to also bring them up to date from various versions (spread from 9.x to 11.x)
Versions
The last version used so far in those instances is Grafana version 12.1.1.
The Terraform provider is version 4.5.3 but I just saw in the link I provided earlier above that it has gone up to 4.6.0, so perhaps I will upgrade that soon as well.
About the exporters, I try to use the latest available but there are some caveats. Like I said earlier, Vmware VCenter exporter is not being maintained but still works. For the windows exporter you need to be careful depending on the Windows Server versions, the latest versions don’t install and run on older Windows Server versions (library issues I guess, there is a version number I will mention when that time comes which maps to compatible Windows Server versions). For Linux hosts I usually run the prometheus exporter nodes with all necessary access to avoid installing them at the OS level (I prefer getting that extra layer of compatibility out of docker). I deploy node exporter, process exporter but also cadvisor to get visibility insider container loads (they do exist in my infrastructure, we got a project coming up on monitoring those as well in the same platform, perhaps I will be able to share stuff).
About docker, I try to use the latest version available as well as for docker compose. The OS used for linux hosts is usually Ubuntu Server LTS and the prometheus servers are based on Ubuntu 24.04 LTS.
What are we doing next.
Nagios is history
As far as my organization is concerned, we have migrated and Nagios is history. What did we get?
- Better visualization
- More scalable alerting
- Modern tooling, continuously maintained by the community and commited companies
- Possibility to extend deployment to cloud and use federated instances (I know, I didn’t talk about that).
- The Grafana Ecosystem (see bullet above)
- The CNCF and Prometheus Ecosystem (plus the combination of those two)
- Eliminated dependency on OS (on Docker now, on Kubernetes or Cloud later)
- Created a layer of independence between the platform components (they no longer run in the same environment or sometimes not even in the same hosts)
- No more security holes and outdated software (CGI/PHP/Apache)
- Infrastructure as Code all the way, no more compiling C.
In short, we kept all features we had with Nagios, but in a better environment.
What comes next in the blog post series
I am not sure if N.K. will be happy with this result, but I did my best to keep it short. Imagine this with all the structure, the code, the processes and the various pitfalls to avoid, I hope I can put that all in eventually in the following posts. So we will next present:
- The structure created for this project, how are the various services/containers deployed with Docker Compose and what is their configuration, what is monitored with git
- How is Prometheus structured and how do things work there
- How Grafana is structured and how do things work there
- How was Terraform installed, what is the structure of the files uses, how are we running updates and adding resources or modifying (I hope that doesn’t take two parts)
- How we test things on Grafana and how we map them back on resources to be provisioned with Terraform.
That’s the ambitious plan. I hope I make it and that it doesn’t last too long. What I want you to keep from this part is that it’s doable, it has already been deployed and that I am happy to give you a small push if you need to in the same direction. But it will take a bit more time before I can share the actual ‘code’ for everything.
Am I forgetting something?
Message Templates..
Oh yeah! What a rabbit hole that was (and the lab rat helped get in there really deep)! I was hoping to be able to customize my alert messages, especially where that silence link was concerned, so I could provide a link to admin teams that they could use in the alert rule endpoint and be able to create silences for the alert rules defined for them, in their own folders.
Forget it. It’s impossible by design (they do that on purpose so you pay for Grafana Enterprise). There is no such URL. Grafana gives that option in a pop up window, you can’t really call that from a simple crafted link. The only option would be to put a software broker type app in the middle where users would authenticate with their AD credentials, be checked on Grafana about what team they belong with through the Grafana API and then have silences be created on Grafana using a user that would have editor level access. Insane right? No thank you lab rat.
But a lot of customization is possible by using template variables (it’s essentially go templates) that you can refer to in your Terraform resource files where you define the contact points (subject and message or title and message depending on whether you use email or ms-teams) but you must combine that with the alert rule resources where you can define summary and description that accompany the alerts but also dashboard UIDs and panel IDs to provide links for those in the alert message (very handy for the user receiving the alert). More on that when we explore the Terraform implementation.
So that was it for Part1! Cu on part-2 or the usual places (you know where to find me, right?)