
(if you are looking for part2, it’s here)
Introduction
I like reading guides, not writing them (it takes too long for me). So this isn’t a guide, it’s more like an adventure tale, it’s a “I got out one day for a stroll and look what happened!”. I had no knowledge of Grafana, InfluxDB, Telegraf or Docker before doing this, apart from a simple definition for each term. The previous monitoring infrastructure was old, difficult to maintain and limited in capabilities, its components slowly dying and out of support. Furthermore, new monitoring needs and novel tech such as Streaming Telemetry and Network Automation were almost impossible to integrate. A big change was due, and it needed to be done soon.
Everything that follows was implemented in a production environment, although test VMs were used for the first tests on installing and using the software.
For those of you that don’t know me, I am a network engineer, I mostly work with Cisco Network Equipment and Software, I have a strong background with Network Performance and Fault management and Monitoring and I try to have an open mind, combining tech from different areas to solve operational challenges and deploy new services. I also have a keen interest in Network Automation. You can find me on Twitter under the @mythryll handle.
A little history
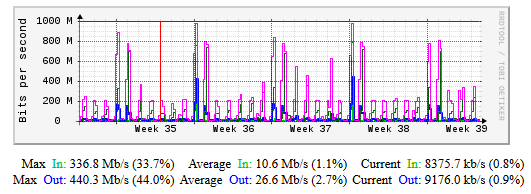
A little over a month ago (maybe two) I took a big plunge. I had been working at my current employer for more than 15 years and almost since the beginning, bringing in a lot of experience with SNMP, I had deployed SNMP network throughput monitoring on MRTG, the well-known network traffic grapher created by Tobie Oeticker, probably the best friend of most network engineers for a long long time. Deploying MRTG was also the start of my involvement with Linux, as I used OpenSuSE linux for it, putting everything (MRTG+Apache) in one server box, and began a parallel life as a semi-serious Linux system admin, taking care of my systems.
That monitoring infrastructure became larger little by little in order to provide metrics for every port in the network (a few thousands) for every network device (a few hundreds). I added more servers, spread out, using physical at start and then migrated them to virtual machines as Vmware took over the Datacenter (I had a hand in that). CPU load, Memory, Temperatures, PS Status, pretty much everything important that had an available SNMP gauge parameter was displayed, even custom metrics produced by running Perl scripts on the core switches (measuring MLS QoS queues on Cat 6500s), or composite metrics (products of several SNMP gathered metrics).
During the migration to the virtual world, the servers were trimmed down as much as possible and RRD/CGI was added to the mix, in order to take the load off from creating PNG files constantly whenever transforming SNMP metrics into graphs. Instead, by using the MRTG-CGI script created by Jan “Yenya” Kasprzak and using RRD to store the data, monitored object web pages and graphs were only created on demand. I had created a decent hierarchical site structure, calling the MRTG-CGI script whenever every link was used, with just the right parameters for every object in order to dynamically create the page for it. I finally added a little Javascript in order to create a light structure, added AD authentication and migrated to Https for securing the access for the right users and groups.
One central web server (Apache) served as the website skeleton and three measuring servers were running MRTG/RRD/CGI for gathering the SNMP metrics and serving them through Apache by responding to requests from links used on the main web server.
The old dog

I had reached the limit for that infrastructure. There were constant problems, RRD files becoming corrupted and having to be deleted, file rights often overwritten, system files updates would cause conflicts with perl snmp libraries used by MRTG and needed manual patching, etc. I had little notification of such issues, only connectivity problems would generate emails for the mrtg local user. Further than that, provisioning for new items to monitor was a pain, since every OID required one specific entry for every network node in the MRTG config (if you ever did that, you know how it is) and once that was done, the WEB UI part was also another task to complete, that usually stayed behind and out of date. Btw, I never liked other solutions like Cacti or Routers2 (sorry Steve), as they didn’t allow enough freedom with the UI.
Upgrading the OS became a nightmare, as RRD files don’t behave well once the system has changed and so history could be lost. The time to perform the upgrade, set everything back as it was, copy over config and data and start the engine again, was too long. There would be gaps in the monitoring data and I had to look for such “free” periods in my schedule, that rarely came up. If the OS upgrade procedure failed (it often did) I had to revert to a snapshot or create everything again from scratch..
Updating perl modules with CPAN was also an issue, as the Security Division’s tools in my Organization would most often cut part of the access to the CPAN mirrors, resulting in file corruption (Security will get you, every time..).
On top of that I had to learn a lot about Apache as well, as significant changes in the software made it necessary to learn the new access rights model and how it would affect the tool, and the dynamic part, based on CGI, was not getting any younger. The CGI script used for dynamic page and graph creation, mrtg-cgi, dated its latest changes back to 2003 and since 2014 there were even security issues involved, you can read about that here.
After I started playing with automation (python, Ansible, netmiko, nornir, netbox, PyATS/Genie, etc) I developed big plans to use Ansible to automatically manage the configuration part. I had already created python scripts to produce the web pages for each network node with every interface on it, began studying Django and DBs, which in fact could come in handy later, and generically sensed that such an old tech could not go any further. RRD is great but not so flexible and not querible. The look was also not so great but I told myself that I am not a web developer so that was ok.
Meeting with Grafana
I had seen Grafana before. I believe it was Cisco’s Jason Davis, that published pics from a Cisco Live Noc at some point (probably Jan 2018) and I began taking a look at it. Then Cisco Devnet’s Stuart Clark mentioned it during a NetDevOps Live Session and I became aware of the fact that there are finally software solutions for network engineers who monitor the network and seek simpler and information rich tools to visualize performance metrics.
At first I thought of going for a small step further, still using MRTG for the collection of data, but replacing RRD with a similar component, like this. Little after starting my search, I realized there was a solution that provided everything in one package, had enough simplicity and robustness to fit in with my goals:
Telegraf, InfluxDB and Grafana, the so-called TIG Stack.
I also came across a post by Jeremy Cohoe in the Cisco Devnet developer blog, about setting up Streaming Telemetry using the TIG stack to consume and visualize the data. As I wanted to deploy Streaming Telemetry for our network as well (I will not develop this here and now), I thought that stepping towards the TIG stack with SNMP, would probably ease that transition as well, later.
So I decided to try that, and began looking for more information. The official documentation for each tool was rich but had no reference on how to combine them in one solution.
Ok, I am convinced.. so where do I start?
I found a few posts about how it worked and how to set it up. Some used it to monitor Host performance metrics on isolated systems, others for home network monitoring (setup on Rasberrypi), others for limited SNMP metrics, and others for Virtual environments, like Vmware/VCenter. I didn’t find any posts or comments about it being used for a large network infrastructure with SNMP. Nothing came up on Twitter either. The Devops world has produced a lot of monitoring tools lately but it’s probably still early for network engineers that traditionally used simpler tools to adopt and use them, so I guess it’s normal.
At first I started with a test server in a VM, Ubuntu 18.04 LTS. I decided to try the procedure suggested in this post, explaining how to setup most things for simple SNMP monitoring and only a few agents (nodes), and combined it with this post in order to better prepare InfluxDB, as the first one does not create a separate Database. Looking into more posts, I started to realize how InfluxDB is very close to a regular database, providing a lot more features but at the same time needing some administration and housekeeping. Besides doing regular queries and deleting test or erroneous data, I found that a very important issue is data retention policy. But more on that later.
What were the main installation steps?
- Setting up the server (dhcp reservation using the mac address after modifying the netplan cfg, packaces up to date, NTP setup, .bashrc modification, blacklist floppy)
- Set up the package repo for InfluxDB and Telegraf
- Install SNMP mibs downloader to get the SNMP MIBII standard mibs (for standard OIDs like the interface table and the system variables) which are not included in the standard server OS.
- Install snmptranslate, if you need to. It can help with checking whether you have the right MIBS installed for every object you need to monitor and troubleshooting your telegraf configuration.
- Install InfluxDB, create a separate telegraf database (besides the default one), create the telegraf DB user, assign access rights
- Install Telegraf (the SNMP input plugin is contained in Telegraf by default, other plugins also available), create a sample config towards an SNMP enabled node (I used a Cat 6500) and test it. Apply the changes.
- Add the Grafana package repo, install Grafana
- Make standard changes to the default config if you need to (e.g. domain, root url, syslog etc)
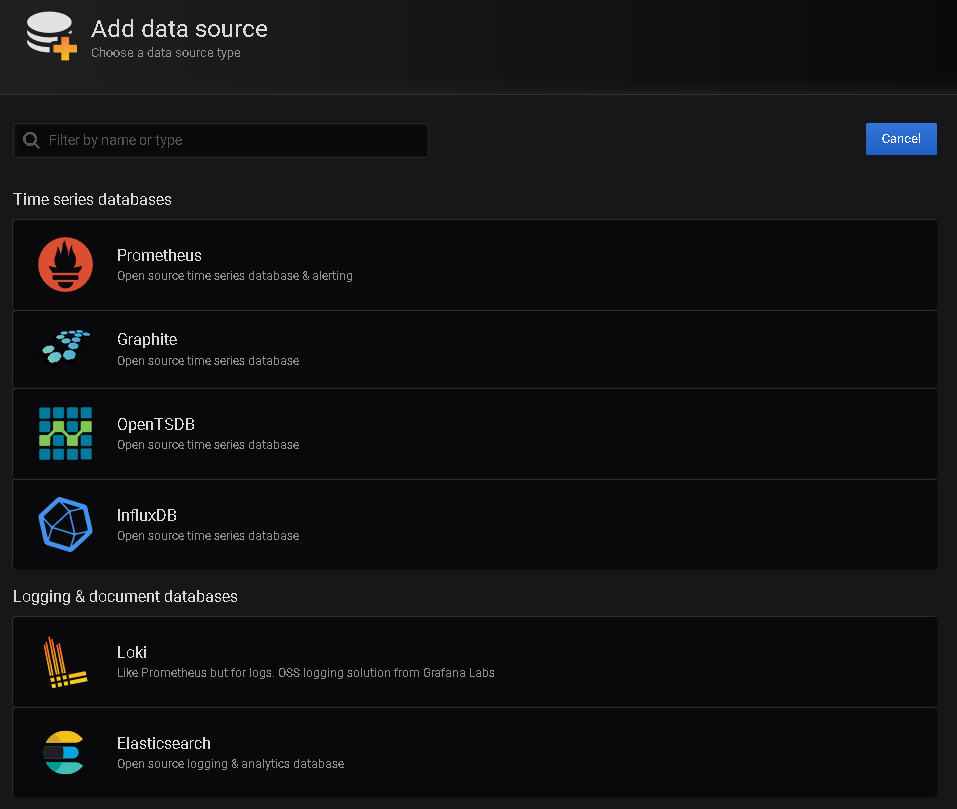
- Login as admin, create a datasource, create a simple dashboard and graph, enjoy and become acquainted to the new environment .
So for my test server, the process was not too complicated, I had done similar things before as I have an aptitude for reading up on new tools and software and integrating them in our environment. What had we we gained so far?
The plus side
- A lot less config effort and time. Configuration on Telegraf for new items to monitor was minimal:
- Every new OID had to be defined only once and it would be monitored for every SNMP agent declared in the config.
- Furthermore, one can define whole tables to be monitored without the need to define every OID in the table.
- The only need to specify different config files for groups of nodes and OIDs would be to specify different polling intervals, SNMP version and communities.
- Configuration on the visualization part (Grafana) will only have to be done once per new item type. Once the dashboards and panels are created, you only have to make sure you are receiving the data from the appropriate data source. For example, a new switch only has to be added to the list of agents in the Telegraf existing config. Unless you are filtering the data in Grafana, you will have that switch’s data available for visualization as well, no extra effort on your part.
- Telegraf allows for more customization of the data, defining tags that can help with the indexing (in fact they are necessary for the visualization of multiple instances of monitored data).
- InfluxDB is a querible database. In fact there is a “query language” called iql for it, similar to sql. So managing the database is possible and so are custom queries that can combine things and we can go back in time as much as we want (provided there is data for it). No more zooming on graphs that hold average values and trying to guess what the data values were three months ago by interpollating graphs.
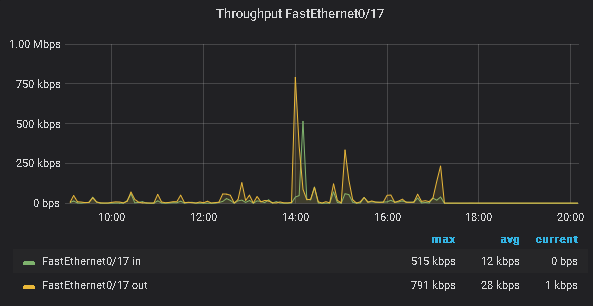
- Grafana is a very flexible data visualization tool, incredibly customizable. The types of visualizations are very diverse and dashboards really come alive in the screen but on top of that there are so many more options and features to be configured and used:
- intuitive UI (I know how many times you may have read something like that, it depends on the person, but trust me it’s easy to get)
- customizable time periods
- user groups and access levels
- various types of datasources and plugins
- integration with other tools at various levels
- programmable APIs
- thresholds and alerts
- notifications
- exporting data in CVS
- All the Stack components can operate independently (same or different machines, close or far), are extensible with plugins, use structured data (e.g. JSON) for communicating, provide APIs that can help with automation and have rich documentation and community support. And oh yeah, all of that is free of course
Wait.. what do we do about dashboards and panels?
Sounds like magic, right? It looks good too and it’s reasonably fast. But in fact, Grafana dashboards and panels are not so easy to create or understand when you first take a look at the tool. In reality, what you are seeing is written in json, data is retrieved with queries upon the data source using parameters defined in the dashboard JSON code and then processed and displayed using Go (not 100% sure on that). There are two ways to go:
- Learn how to create your own, by reading either independent user posts or the doc (good luck, it takes time, however you may end up having to read the doc anyway)
- Download a ready dashboard from the Grafana website and start fooling around with it in order to understand the structure and what needs to be modified to adapt to your needs. For example here is an example for an interface stats dashboard, mind the dependencies mentioned (influxdb, telegraf): https://grafana.com/grafana/dashboards/10668
If you have a lot of time, start with the 1rst option. If you know a few things about json or have played with python dictionaries, you may have an easier time with the 2nd option. No matter what you choose, eventually you will probably try both. I will comment more on the dashboards and panels in the next parts of this series of posts. For now let’s say it was a necessary but confusing part of my journey.
Ok.. Are we ready to go then?
I could have stopped there and deployed on production. But there were more things to consider:
- Ok so we have lessened the burden of configuration and provisioning for monitoring sources and their visualization. But did we get rid of the maintenance overhead for the OS and the libraries? Certainly not.
- By streamlining the installation process we could of course automate it, using either large bash scripts or Ansible (or your system automation tool of choice), but we would still have to do something about the VM, like creating a VM template ready to be deployed in minutes in case things go terribly wrong.
- We still have to worry about the dependencies for the software. If things change in that area we may find ourselves in trouble trying to fix it, while our monitoring is halted and data is lost.
- We definitely need a backup procedure to preserve the performance DB data and schema. That can’t be helped no matter what you do. Vmware backup solutions usually go for the whole VM but in case one goes for file backup, DB manipulation will be necessary ( essentially stopping the tools)
- What about updating the tools themselves? Well in that area one has to go with what the software creator has to offer. In our case let’s not forget that two of the tools are DB based, so there is an update effort there too. Sometimes the packages update procedure is enough.
- What about Https? After all this, a standard installation leaves us with an Http based service. Well that’s the easy part. If you have ever setup HTTPS on Apache or Nginx, doing the same with Grafana is a piece of cake. The documentation is simple enough. If however you have no idea how to create a CSR, create certificates for your server and installing them, then track me down on twitter and I will do my best to provide some directions in order for you to find your own way with it.
- What about LDAP/AD integration? That part was not so easy to figure out. I will develop this in the next part of the series but getting the software to allow your AD users in is one thing, correctly reading group information and assigning roles is another. It turned out to be easier than I thought but at that point I had tried using my Netbox experience and failed (in fact I believe I had done things wrong with Netbox as well in that area). So my confusion remained for the time being.
- What happens if we need to recreate our datasources, dashboards and panels? Would all that work go to waste? Well, the fact that there are dashboards you can download and that Grafana has multiple points of access to the json dashboard and panel code, as well as options for dashboard import and export to json (mind the option for “sharing externaly”), it seems possible that one can save the dashboards one by one in files in json format and then have them inserted back in a “clean” system. But what about the datasources? Well no export option in the gui for that but what the heck, it’s only a few sources, right? Well not exactly. The dashboards and panels depend on your datasources (they are explicitly mentioned in the JSON code). When you try to change a datasource in a dashboard (for example in the variables section) or in a panel, you will probably end up loosing your query text and may have to recreate everything. Even if you don’t come to face that problem, it’s still a lot of work and there is much room for error. You may have guessed where I am getting at .. APIs and auto-provisioning (using Yaml files). Grafana provides both. You can choose to use either or both. But more on that also in the next parts of the series.
- What about adding more MIBs, custom vendor ones? What about providing notifications? What about alerts? Adding more MIBs was not so hard to figure out but the rest of the questions and more issues, remained a source of confusion.
The calm before the storm
At about that time I came to a realization: There was only so much I could do in the test environment. I could not transfer the historical data from the old system to the new one and I certainly didn’t want a full test deployment to burden the network devices by deploying the SNMP queries twice, one for the old and one for the new system. So there was no point in waiting any more.
While studying using the Cisco Devnet Streaming Telemetry Sandbox back in August and September, I came across Docker containers as they were heavily used in the lab. I knew what containers were conceptually but never actually had put my hands on to a docker installation. In order to better understand how the Streaming Telemetry infrastructure was staged, I started to scratch the surface. I learned how to start and stop containers, how to create a pseudo-command line terminal in order to execute commands and a general idea on how they are created and orchestrated.
After verifying the availability of docker images for all components of the Stack, I finaly decided to take the plunge:
Engage!
- I would install Docker on the main web server of the old system and deploy Grafana using a docker container.
- I would scrap one of the measuring servers and replace it with a new Ubuntu 18.04 VM, using the same network parameters, deploy Docker on that one too, and then InfluxDB and Telegraf again using Docker containers.
- I would recreate the structure of the test system, transfering the measuring duties of the old measuring server to the new one and visualize metrics on the new container based Grafana system.
- I would repeat the process with the rest of the measuring servers, until every performance parameter previously monitored by MRTG was monitored by Grafana.
- As a last step I would scrap the old web server, replace it with a new Ubuntu 18.04 virtual machine and recreate the same Grafana Docker container again on that docker host.
I did face some difficulties that forced me to change the plan a bit. But this is where the first part of the series will stop. Before I leave you, I promise that the next part will come a little before Christmas (hopefully).
Cu in the next part!
PS: I am including below a processed sample of the command line history from the test VM, to help you get a better idea of how it went about. Obviously there are parts missing or modified (sanitized). Do not copy/paste, just read.
#Initial Setup part
    1  vim /etc/ssh/sshd_config
    6  vim .bashrc
    9  vim /etc/netplan/50-cloud-init.yaml
   12  vim /etc/modprobe.d/blacklist.conf
   14  apt-get update
   15  apt-get upgrade

#This is where the installation begins. You can see I tried
#going the apt way..
   17  sudo curl -sL https://repos.influxdata.com/influxdb.key | sudo apt-key add -
   18  source /etc/lsb-release
   19  echo "deb https://repos.influxdata.com/${DISTRIB_ID,,} ${DISTRIB_CODENAME} stable" | sudo tee /etc/apt/sources.list.d/influxdb.list
   20  sudo apt update
   21  sudo apt install influxdb
   22  apt-get update

#And this is where the Security Division ruined my day, so I went
#with downloading and installing the packages manually
   23  wget https://dl.influxdata.com/influxdb/releases/influxdb_1.7.8_amd64.deb
   24  sudo dpkg -i influxdb_1.7.8_amd64.deb
   25  systemctl status influxdb
   26  systemctl start influxdb
   27  systemctl enable influxdb
   28  systemctl status influxdb

#At this point we need to get inside influxdb and create database
#dbuser and assign access rights
   29  influx
   30  wget https://dl.influxdata.com/telegraf/releases/telegraf_1.12.1-1_amd64.deb
   31  sudo dpkg -i telegraf_1.12.1-1_amd64.deb

#Don't forget that if your telegraf service is not in the same host
#with your influxdb service, you need to modify the main telegraf
#config in /etc/telegraf/
   32  sudo systemctl start telegraf
   33  sudo systemctl status telegraf
   34  sudo apt install snmp snmp-mibs-downloader

#after you get the default mibs, manipulation for this file is
#needed and the same happens with other mibs (like vendor mibs).
#you also need to put the extra mibs in the same place, /usr/share/snmp/mibs or you will have a lot of trouble making it work.
   35  vim /etc/snmp/snmp.conf
   36  snmpwalk -v 2c -c community ipaddress system

#you can put the extra conf files in this dir, it's enabled by
#default in the packaged version (not the same on the Docker image,
#be careful)
   37  cd /etc/telegraf/telegraf.d/
   38  vim accore6509.conf
   39  telegraf --test --config /etc/telegraf/telegraf.d/accoreMK6509.conf
   40  sudo systemctl reload telegraf
   41  cd
   42  wget https://dl.grafana.com/oss/release/grafana_6.3.5_amd64.deb
   43  sudo dpkg -i grafana_6.3.5_amd64.deb

#I don't remember what this was for.
   44  apt-get install libfontconfig1
   45  apt --fix-broken install
   46  sudo dpkg -i grafana_6.3.5_amd64.deb
   47  sudo systemctl enable grafana-server

#this checks for active service ports on your host
   48  netstat -plntu

#this is the part for the certificates installation for https. You
#can't see the whole thing here, I am mostly fooling around.
   68  cd /etc/grafana
   70  vim grafana.ini
   71  scp root@xxxxx:/etc/apache2/ssl/* ./
   72  ls
   73  ls -al ssl
   74  vim grafana.ini
   75  systemctl restart grafana
   76  systemc
   77  systemctl restart grafana-server
   78  systemctl status grafana-server

   82  ls
   83  vim grafana.ini
   84  systemctl restart grafana-server
   85  systemctl status grafana-server

   99  cd ssl/
  100  ls
  101  openssl genrsa -aes256 -out test.key.pem 2048
  102  openssl rsa -in test.key.pem -out test.nopasswd.key.pem
  103  vim my_openssl.cnf
  104  openssl req -config my_openssl.cnf -key test.nopasswd.key.pem -new -sha256 -out test.csr.pem -subj "/C=GR/ST=TheProvince/L=City/O=Organization/OU=YELS/CN=test.ourdomain.gr/emailAddress=nocteam@whereIwork.gr"
  105  ls -al

#this is where I started checking the snmp part for the host. If
#those work you can put those OIDs in your telegraf configs
  106  cd /etc/telegraf/
  107  ls
  108  vim telegraf.d/accore6509.conf
  109  systemctl restart telegraf.service
  110  systemctl restart influxd
  111  systemctl restart grafana-server
  112  vim telegraf.d/accore6509.conf
  113  systemctl restart telegraf.service
  114  systemctl restart influxd
  115  systemctl restart grafana-server
  116  snmpwalk -v 2c -c community ipaddress IF-MIB::ifTable
  117  snmpwalk -v 2c -c community ipaddress IF-MIB::ifDescr
  118  snmpwalk -v 2c -c community ipaddress IF-MIB::ifAlias
  119  vim telegraf.d/accore6509.conf

#you can test the config before you activate it in telegraf.
#Activation happens upon restarting the telegraf service
  123  telegraf --test --config /etc/telegraf/telegraf.d/accore6509.conf
  124  systemctl restart influxd
  125  systemctl restart grafana-server
  138  influx
  139  systemctl stop grafana-server
  140  systemctl stop telegraf.service

  147  systemctl start telegraf.service
  149  systemctl start grafana-server

  157  systemctl restart telegraf.service
  158  systemctl restart influxd
  159  systemctl restart influxdb
  160  systemctl start grafana-server
  161  systemctl restart grafana-server

#this is the part where I started fooling around with ldap and AD
  174  locate ldap.toml
  175  cd /etc/grafana/
  176  vim ldap.toml
  177  systemctl restart grafana-server
  178  vim ldap.toml
  179  vim grafana.ini
  189  more /var/log/syslog
  190  tail -500 /var/log/syslog | grep ldap
  191  systemctl restart grafana-server

#at this point I realized I should have installed ntp service from
#the start. It's not included by default in Ubuntu server. The logic
#is the same for a workstation, it syncs with internet based
#servers, if you need to config more stuff you need the ntp package.
  224  date
  225  echo $LOCALE
  226  echo LOCALE
  227  timedatectl
  228  timedatectl list-timezones
  229  systemctl stop grafana-server.service
  230  systemctl stop influxdb
  231  systemctl stop telegraf
  232  sudo timedatectl set-timezone Europe/Athens
  233  timedatectl
  234  apt-get install ntpd
  235  apt-cache search ntp
  257  apt-get install ldapsearch
  258  apt-get update
  259  apt-get upgrade
  260  sudo apt install ldap-utils
  261  ldapsearch -H ldap://ldapserver:ldapport -D "CN=ldapusername,OU=Special Purpose,OU=UsersOU,DC=yourdomain,DC=gr" -w "bigstrongpassword" -v -d 1  -LLL "(sn=theodoridis)" -u cn sn telephoneNumber sAMAccountName
  262  ldapsearch -H ldap://ldapserver:ldapport -D "CN=ldapusername,OU=Special Purpose,OU=UsersOU,DC=bankofgreece,DC=gr" -w "bigstrongpassword" -v -d 1  -LLL "(cn=itheodoridis)" -u cn sn telephoneNumber sAMAccountName
  263  vim ldap.toml
  264  systemctl restart grafana-server.service
  277  tail -500 /var/log/syslog | grep ldap
  294  cd /etc/grafana/
  377  cd /etc/snmp
  378  ls
  379  vim snmp.conf
  380  cd /usr/share/
  381  ls
  382  cd snmp/
  383  ls
  385  cd mibs
  386  ls
  387  cd ..
  388  ls -al

#lots of snmp tests
  393  snmptranslate .1.3.6.1.4.1.9.9.109
  394  vim /etc/snmp/snmp.conf
  395  snmptranslate .1.3.6.1.4.1.9.9.109
  396  vim /etc/snmp/snmp.conf
  397  snmptranslate .1.3.6.1.4.1.9.9.109
  398  snmptranslate .1.3.6.1.4.1.9.9
  399  snmptranslate .1.3.6.1.4.1
  400  snmptranslate .1.3.6.1.4.1.9.9
  455  snmptranslate 1.3.6.1.4.1.9.9.109
  456  snmptranslate CPULoadAverage
  457  snmptranslate cpmCPUTotal5min
  458  vim /etc/snmp/snmp.conf
  459  net-snmp-config --default-mibdirs
  460  apt install libsnmp-dev
  461  net-snmp-config --default-mibdirs
  462  snmptranslate cpmCPUTotal5min
  463  snmptranslate 1.3.6.1.4.1.9.9.109
  464  snmptranslate -IR -0n cpmCPUTotal5min
  465  snmptranslate -IR -On cpmCPUTotal5min
  470  snmptranslate -On CISCO-PROCESS-MIB::cpmCPUTotal5min
  484  snmptranslate -On CISCO-PROCESS-MIB::cpmCPUTotal5min
  485  snmptranslate -On /usr/share/snmp/CISCO-PROCESS-MIB::cpmCPUTotal5min
  486  snmptranslate -On /usr/share/snmp/othermibs/CISCO-PROCESS-
MIB::cpmCPUTotal5min

#more tests, you can see vendor mibs too below. Putting the mibs in
#separate directories didn't work, no matter how much I tried adding
#the dirs in the config.
  510  snmptranslate CISCO-PROCESS-MIB::cpmCPUTotal5min
  511  snmptranslate CISCO-PROCESS-MIB.my::cpmCPUTotal5min
  512  snmptranslate cpmCPUTotal5min
  513  vim /etc/snmp/snmp.conf
  514  snmptranslate cpmCPUTotal5min
  515  snmptranslate CISCO-PROCESS-MIB.my::cpmCPUTotal5min
  516  snmptranslate cpmCPUTotal5min
  517  vim /etc/snmp/snmp.conf
  518  snmptranslate cpmCPUTotal5min
  519  snmptranslate CISCO-PROCESS-MIB::cpmCPUTotal5min
  520  snmptranslate -IR CISCO-PROCESS-MIB::cpmCPUTotal5min
  521  snmptranslate -Ir CISCO-PROCESS-MIB::cpmCPUTotal5min
  522  snmptranslate -R CISCO-PROCESS-MIB::cpmCPUTotal5min
  523  snmptranslate -IR cpmCPUTotal5min
  524  snmptranslate -On CISCO-PROCESS-MIB::cpmCPUTotal5min
  525  snmptranslate -On cpmCPUTotal5min
  526  snmptranslate -Ir-On cpmCPUTotal5min
  527  snmptranslate -Ir -On cpmCPUTotal5min
  528  snmptranslate -IR -On cpmCPUTotal5min
  529  snmptranslate -IR -On cpmCPUTotal1min
  530  snmpwalk .1.3.6.1.4.1.9.9.109
  532  snmpwalk -v 2c -c community ipaddress .1.3.6.1.4.1.9.9.109
  553  snmptranslate -IR -On snmptranslate -IR -On cevChassisCat6509
  554  snmptranslate -IR -On snmptranslate -IR -On CISCO-ENTITY-VENDORTYPE-OID-MIB::cevChassisCat6509
  555  snmptranslate  1.3.6.1.4.1.9.12.3.1.3.144
  557  snmptranslate cpmCPUTotal5min
  558  snmptranslate -IR -On cpmCPUTotal5min
  559  snmptranslate -IR -On ifConnectorPresent
  560  snmptranslate -IR -On cpmCPUTotal5minRev7
  561  snmptranslate -IR -On cpmCPUTotal5minRev
  562  snmptranslate -IR -On cpmCPUTotal5min
  563  snmpwalk cpmCPUTotal1minRev
  564  history | grep snmpwalk
  565  snmpwalk -v 2c -c community ipaddress cpmCPUTotal5min
  566  snmpwalk -v 2c -c community ipaddress cpmCPUTotal5minRev
  567  snmpwalk -v 2c -c community ipaddress cpmCPUTotal1minRev
  572  snmptranslate -IR -On CISCO-PROCESS-MIB::cpmCPUTotal1minRev
  573  snmptranslate -On CISCO-PROCESS-MIB::cpmCPUTotal1minRev
  574  snmptranslate -On cpmCPUTotal1minRev
  575  snmptranslate -On CISCO-PROCESS-MIB::cpmCPUTotal1minRev
  576  vim /etc/telegraf/telegraf.d/accoreProcStats.conf
  577  history | grep telegraf
  578  telegraf --test --config /etc/telegraf/telegraf.d/accoreProcStats.conf
  579  vim /etc/telegraf/telegraf.d/accoreProcStats.conf
  580  snmpwalk -v 2c -c bog ipaddress cpmCPULoadAvg1min
  581  snmpwalk -v 2c -c bog ipaddress cpmCPULoadAvg5min
  582  snmpwalk -v 2c -c bog ipaddress cpmCPULoadAvg15min
  583  snmpwalk -v 2c -c bog ipaddress cpmCPUTotal1minRev
  584  snmpget -v 2c -c bog ipaddress cpmCPUTotal1minRev
  585  systemctl restart telegraf
  586  systemctl status telegraf

#I checked for disk space usage as I didn't want things to blow up.
#Remember the retention policy? Look for that discussion in the next
#part of the series
  587  du
  588  df

# More tests
  600  snmpget -v 2c -c community ipaddress cpmCPUTotalIndex
  601  snmpget -v 2c -c community ipaddress cpmCPUPhysicalIndex
  602  snmpget -v 2c -c community ipaddress cpmCPUTotalPhysicalIndex
  603  snmpwalk -v 2c -c community ipaddress cpmCPUPhysicalIndex
  604  snmpwalk -v 2c -c community ipaddress cpmCPUTotalIndex
  605  snmpwalk -v 2c -c community ipaddress cpmCPUTotalPhysicalIndex
(the adventure continues on part 2)