

Part-2 Intro
In part-1 of this series, we discussed a lot about the background of this story, how the SLM platform evolved originally, what were its short-comings and how and why it wasn’t enough anymore. Then how the research was done, what the prospects were and were we ended up in the end, after a lot of effort and time. In this part-2, we will show how we built the platform, but in a way more descriptive and useful so it can be replicated.
Whether we go all the way, right up to the Terraform part, what course we took, how I propose to do things and what are the pitfalls to avoid, or whether that becomes a part 3 (or part-4), remains to be seen, as I am starting to write this post.
Foundations
Host OS, Docker and Docker Compose
Not sure what your favorite type of installations are for tooling. I prefer docker these days, but as we have discussed in part-1, others like my colleague G.K., prefer Kubernetes. So, to start with, I propose a clean server install of Ubuntu 24.04.3 LTS (latest at the current moment), where you would only make sure to set correct timezone for your area and only absolute basic stuff you need in your environment and then set up docker and docker compose. I use the guides in Digital Ocean as I have mentioned multiple times in previous posts. They also have a great intro to using docker, adding users to the docker group, popular commands, anything you need to get started. So use this for the Docker install, and possibly this for installing Docker Compose, but make sure you get the latest release from github, here. Two pieces of advice on using guides for the ones above:
- Always make sure you are not installing packages or adding repos (or at least trying to) for a previous Ubuntu architecture. The guide above looks less particular for the latest Ubuntu release but gets the appropriate architecture from your system so it works ok. If you were trying to get one referring let’s say to Ubuntu 22.04 LTS, then you might be trying to add the wrong repo..
- The guide for docker compose follows the v.2 docker architecture where docker compose is registered as a plugin, so be aware of that. The current release as this post is written is 2.40.0 so if you replace the version in the curl command you will probably get the right one, for example:
curl -SL https://github.com/docker/compose/releases/download/v2.40.0/docker-compose-linux-x86_64 -o ~/.docker/cli-plugins/docker-composeWhat is the plan?
We need to install all the prerequisites (basically what’s included in the previous paragraph, I will not go into the OS setup, check that as well with Digital Ocean guides if you need to), create the project folder structure, put all the necessary files there, do the necessary adjustments in the config, get any certificates needed, define our targets for scraping and launch the docker compose. What this gets us, is a working Prometheus instance and a working Grafana instance. The Prometheus instance will already be trying to scrape data but the Grafana instance will be empty. That’s where we will eventually create all the necessary resources with Terraform after configuring the absolute essential things in the UI. But let’s start at the beginning, shall we?
Proposed Project Folder structure
The folder structure I am proposing is the following but you can obviously do it differently if you want to:
.
├── alertmanager
├── blackbox
├── grafana
│   └── etc
├── process_exporter
├── prometheus
└── terraform
    └── backup
It’s sort of self-explanatory, but I should probably offer a little more context. Docker compose goes in the root directory of the project. I most often use /opt/ for projects so this would be under /opt/prometheus/. The services (simply put the project components) get a sub-folder each. The configurations for each service are put inside the corresponding folder and the configurations files are mounted inside the containers. All these mounts are defined inside the docker-compose.yml file at the project root folder.
Now.. Git!
Yes git is used and it would be a good idea that you use it as well to track changes in the configuration files for everything. As I had in mind to also be able to create exact copies of the infrastructure for a test site and a disaster recovery site, I had to keep certain files and directories out of it, to allow both for diversity but also for security reasons. I did include them though in a repo I created for this article so you can get a reference for everything (as much as possible of course). Needless to say that the data in this repo have been thoroughly cleaned and that nothing you can find in there points to real data in the actual infrastructure where all this has been created and is being used. Here is the repository in github that you can use to understand the project better and perhaps clone to get a local copy that you can modify and make it work for you. I will not tell you how to clone it. You should either already know how that works if you are interested in such a project or you should be able to look it up on your own. After all there is so much space and time we can use to accommodate everything in a blog post (or a series).
https://github.com/itheodoridis/prometheus_with_grafana_and_terraform
If you don’t modify it, it will not work. You will probably be successful in getting some images downloaded but one and there’s where it will probably stop for you. You will need better understanding in the project in order to modify everything according to your needs and adjust the proper references between the components.
gitignore (make sure everything goes in from the start or else… gitignore will ignore you)
.gitignore is very important. It’s where you exclude secrets you don’t want to include in a repo, cached files that carry too much bloat and are re-created and constantly modified when you run things so there’s really no need to store them and things that may change from deployment to deployment and probably don’t belong inside the repository.
One thing to note about .gitignore is that if you don’t think about excluding something from the start and try to exclude it later, you will find that the file doesn’t go away from the repo. The reason is it remains cached. So if that happens you have two solutions, one being deleting the .git folder and starting all over again. And I won’t tell you what the second is (not teaching you git here, plus I am an unfit teacher). Let’s take a look at the .gitignore contents:
ssl/
grafana/etc/ldap.toml
terraform/.terraform/
terraform/disabled/
terraform/terraform.tfstate
terraform/terraform.tfstate.backup
terraform/.terraform.lock.hcl
terraform/variables.tf
terraform/notification_policies.tf
docker-compose.yml
users_export*json
As an example of what I said earlier you will find that the docker-compose file should not have been in the repository since it’s in the .gitignore file. But as you might have guessed, in order to get it up on github, I initially had that line commented, so it got included initially, then removed the comment so it’s in the right form in the file but still there in the repo. Putting inside the .gitignore file does not remove it from the repository. In case you succeed in removing it in the current commit, be aware that it’s still there in the git history. So again, think things through and never include secrets in the repository, they never go away (unless you delete the repository before anyone clones it).
What should you do about it? Probably delete the .git folder you got because of the cloning and then start modifying everything according to your liking and initialize your own local repository when you think the time is right.
git remote and credentials
Whether you use plain cli commands or a helpful editor like vscode, after you initialize the repository, add the files to the staging area and try to do the first commit, you will get a message about the user data like the user’s name and email. To further be able to use a remote git server to store your data with git push (essentially what github does but you can also do it locally), you will need to set up that remote git server and your credentials for it. I will not get into it, but you can take a look here for how to manage remote repositories:
https://docs.github.com/en/get-started/git-basics/managing-remote-repositories
You will also need to define the credentials for that. You can use a credential helper store so that git reads the credentials from a local file called git-credentials, or you can either store that under the .git folder in your user directory or in the global git configuration. I believe by default git uses the user directory to look for those. Take a look here: https://git-scm.com/docs/git-credential-store. So in accordance to that, you could use a command like (this affects the global config, as the switch implies):
git config --global credential.helper storeAfter running this command, the next time you perform a Git operation (like git push or git pull) that requires authentication, you will be prompted for your username and password. Once you provide them, Git will save these credentials to a file named .git-credentials in your home directory (e.g., ~/.git-credentials). Subsequent operations will then automatically use the stored credentials.
Local Remote or Remote Remote?
Well, depending on your situation, you maybe operating inside an organization or enterprise, working on a substantial home lab or just testing things on your laptop. In any case you are limited mainly be resources and time. If you really want to try things as they would work in the real world, you can even setup a Gitlab CE (Community Edition) locally, with docker compose, so that you have both a central git server but also a way to test CI/CD, a docker image registry, a python package registry, etc. Of course it takes some work and perhaps I will try and do a relevant blog post at a later time. In the meantime, take a look here if you want to get started with it:
- https://docs.gitlab.com/install/docker/installation/ – Official Gitlab Documentation
- https://dev.to/teetoflame/setting-up-a-gitlab-server-community-edition-and-a-gitlab-runner-using-docker-compose-ob6 – Dev.to introductory blog post
- https://medium.com/@BuildWithLal/gitlab-setup-using-docker-compose-a-beginners-guide-3dbf1ef0cbb2 – Medium blog post
Keep in mind that both sites start requiring a subscription for some of the hosted blog posts and in fact you can probably read things on Dev.to with a Medium subscription (I am subscribed, there are interesting posts on it). However you will find that those blog posts you can find on those platforms are rarely like mine, meaning they are much shorter and can only serve to give you an idea so you can start digging on your own. So go ahead and dig, or just use a private repository on Github if you have faith on such public services and their discretion.
Docker Compose services composition
As I already mentioned, the docker compose file has several blocks and one of those is the services block. In there every entry defines a separate container that will be created according to what parameters are defined in that section.
Prometheus
Volumes
Prometheus needs two configuration files in order to operate. One is the main config file (prometheus.yml) and the other is the file that is configuring the alerts (alert.yml), both included in the following bind mount in the Prometheus service section:
    volumes:
      - ./prometheus/:/etc/prometheus/
Contrary to what you may think, the alerts you may want to route via the Alert Manager are configured in Prometheus. Alert Manager defines how alerts are routed. But in our scenario, as discussed in part-1 , we don’t really want to define alerts in Prometheus or route them through the external Alert Manager. I do leave it there so the default structure is maintained. That also means that we get an instance of that default alert source in Grafana later on.
The other entries under the volumes section are about the certificates for the server and the public certificate of the ca (full chain) that is needed to verify the validity of the certificates of the targets (where the data are waiting to be scraped). There is also one other entry that defines that the data contained in Prometheus (under /prometheus inside the container) will be placed in the named volume prometheus_data that is already defined in the volumes section of the docker-compose file:
volumes:
    prometheus_data: {}
    grafana_data: {}
The two final entries are about making sure that the container operates in the same timezone and time and date as the docker host (it’s about time synchronization essentially).
Other parameters
What else is there in the Prometheus service section? Let’s look at everything else except the commands section:
    image: prom/prometheus:latest
    container_name: prometheus
    hostname: prometheus_srv-pgslm-01
    restart: unless-stopped
    expose:
      - 9090
    ports:
      - "9090:9090"
    networks:
      - monitor-net
    depends_on:
      - cadvisor
The image parameter defines which image will be used to create the container. The latest tag will currently get you version 3.7.3 according to the tags section in dockerhub under Prometheus. Keep in mind that using the ‘latest‘ tag in your docker-compose files is not the best strategy as you may end up upgrading an instance by accident just because you deleted the local image which was in an earlier version but also tagged as ‘latest‘ at the time you first downloaded it. Keep the ‘latest‘ tag only if that is your intention, not just to ‘get the latest for this time only‘.
The container_name parameter defines what you will see if you run: docker ps in the terminal or docker container ls etc. It’s the name of the container as seen on the docker host.
The hostname parameter defines the system name as seen from inside the container. Why is that important? Well this is what you will get as the name of the host when you later look at metrics for this container. If you don’t define it in a way that lets understand which host’s data you are looking at, you will have a hard time later on.
The restart parameter is a classic. The value ‘unless-stopped‘ is probably the best strategy so that a container starts up again after a failure or a reboot, unless you stopped it yourself.
Expose is sort of the old way to define what port is ‘exposed’ on the container itself even from inside the isolated docker bridge network used by the rest of the services from the same project (not opening the subject of virtual/software bridges used in such environments). It’s not really necessary.
Ports is where you define how internal container ports are mapped externally (external/internal – look here) at the docker host level so the services can be reached from the rest of the network.
Networks defines the bridge used which can either be the default (in that case every service on that bridge can reach all the rest on the same bridge) or a particular one defined in your project file as in this case, or you could even isolate services between themselves by putting their communications on separate bridges.
The depends_on parameter defines indirectly the order the services are launched, it’s kind of important if you are expecting things to be available that particular service is launched. In this case cadvisor is a target where data is scraped for the status of the containers in that docker host.
I will not explain those four for you for the other services, I hope you got it by now.
Commands – Paths – Retention – Reload config
What about the commands section? Everything plays an important role, and I will explain most of it:
command:
– ‘–config.file=/etc/prometheus/prometheus.yml’
– ‘–storage.tsdb.path=/prometheus’
– ‘–web.console.libraries=/etc/prometheus/console_libraries’
– ‘–web.console.templates=/etc/prometheus/consoles’
– ‘–web.external-url=http://srv-pgslm-01.company.com:9090/’
– ‘–storage.tsdb.retention.time=60d’
– ‘–storage.tsdb.retention.size=25GB’
– ‘–web.enable-lifecycle’
The first option defines the location of the configuration file. If you take a look at the bind mounts mentioned earlier you will understand that the external file we are mounting serves as the config file for the Prometheus process inside the container. The next option defines where the Prometheus data lives inside the container which again is the path that is linked to the named volume we mentioned earlier. I will not tell you what named volumes are, take a look at the links below:
- https://docs.docker.com/engine/storage/volumes/
- https://docs.docker.com/reference/compose-file/volumes/
Let’s ignore the next two options and go directly to the web.external-url, which defines how Prometheus is reached from the outside. If you let Prometheus’s port exposed than you can direct your browser to that url (provided dns works in your environment and that hostname is defined, don’t even get me started on certificates and how you create those.. Bart told me I might as well have been writing a book.. but I really don’t want to do that, I just want to share this.. sigh…).. So if you decide to keep Prometheus exposed and serve the content with https, you would need to change that, but also make sure the rest of the configuration changes follow along, for example in the Grafana data source. Here take a look at this, if you want to go down that road. I didn’t, as I intend to ‘hide’ Prometheus from outside reach down the road.
The last three configuration options are very important. storage.tsdb.retention.time defines how long data is to be stored in Prometheus and storage.tsdb.retention.size defines a different ceiling in case data get too big on storage even if the time limit has not been reached. Unless you want your monitoring instance to fail because your db ran out of space, you really want to make sure those two are there, but remember to define your own limits.
Finally, the last configuration option web.enable-lifecycle defines that if Prometheus detects a change in configuration or receives a relevant signal at the /reload endpoint, it reloads with the updated configuration. You can cause that to happen also via the command curl -X POST <your_prometheus_server_url>:<port>/-/reload . More on Prometheus when we take a look at the config file.
Portainer
Portainer has really nothing to do with what is needed in this solution but it’s a nice local solution if you want to get a look at what is happening in your docker host but also do a lot more with managing the docker side. It can be used to manage things via a central point as well.
Portainer has a community edition and an enterprise edition and can also handle Kubernetes environments. It needs the docker API to be reachable for it to work remotely and it usually occupies a port by default that may be needed elsewhere (it has already happened to me more than once, that’s why I remapped the port in the docker-compose file).
You would have to check how to access to docker API remotely, possibly also how to authentication should be setup, plus a lot more. You can probably run it locally on targets too if you want to only get local visibility per host, as it gets access to docker through the bind mount:
    volumes:
      - /var/run/docker.sock:/var/run/docker.sock
Up to you to keep it in or eliminate altogether. If you keep it make sure you don’t leave any open holes.
Node Exporter
Node exporter is the source of information for linux based hosts. It can also be enriched to host custom metrics in the form of file sources. This service is defined in the docker host for Prometheus and Grafana in order to monitor that docker host itself (the localhost as we would reference it). That is why it gets all those bind mounts in the volumes section, in close connection with the command options and finally the user and privileged parameters to allow the needed level of host access:
    user: root
    privileged: true
    volumes:
      - /proc:/host/proc:ro
      - /sys:/host/sys:ro
      - /:/rootfs:ro
      - /etc/timezone:/etc/timezone:ro
      - /etc/localtime:/etc/localtime:ro
    command:
      - '--path.procfs=/host/proc'
      - '--path.sysfs=/host/sys'
      - '--collector.filesystem.ignored-mount-points=^/(sys|proc|dev|host|etc)($$|/)'
We also run it at the targets where we have linux hosts in order to monitor hosts parameters. I usually do it using docker. My fellow co-admins prefer to avoid running docker in some systems and go for the os service, or even enrich a separate node exporter with metrics that are gathered from the original targets with scripts. I would personally prefer to use a push gateway in that scenario but if you are limited in running other languages in such environments due to security reasons and platforms (long live SE Linux plus other reasons), than I guess you have to do things the way you have to do things.
You may view this as a security problem. I understand that. I choose to do it this way. You can choose to run it as a service on the host. I prefer to keep my dependencies on the host as few as possible so I can change os or even the host itself without too much trouble (in this case however in my naming scheme I would need to change the container name as well..). It’s a balance. Up to you. If you keep in docker container form and need to add custom metrics through a file source, you may need to do more bind mounts..
If you are interested in doing that (we did it), feel free to watch the video above but also check out this github repo with scripts that could provide data for it: https://github.com/prometheus-community/node-exporter-textfile-collector-scripts.
I also found this but I am still not sure what I am looking at.. Maybe you can figure it out, seems important 🙂 https://prometheus.github.io/client_python/exporting/textfile/ (hint: it’s from the prometheus python client documentation apparently but on our current subject).
Process Exporter
Process Exporter provides visibility in system services and processes inside a linux os. You may be able to get such visibility using node exporter with certain techniques but Process Exporter provides a more detailed view for them without the need for additional configuration. These are the most notable parameters:
    privileged: true
    volumes:
      - /proc:/host/proc
      - ./process_exporter/:/config/
    command:
      - '--procfs=/host/proc'
      - '-config.path=/config/process-exporter.yml'
So the privileged parameter is set here as well, and so is the /proc mount and the relevant command option for --procfs . The other mount and respective command option are used to define the config file.
Cadvisor
Cadvisor is a great way to get metrics for your containers running where you are running Cadvisor. It’s what we often call, a sidecar container (something running aside your systems, informing you of their status, taking advantage of the fact that it can access common resources through the same platform). In this case we run it to check on the Prometheus and Grafana Server host but the same goes for target systems.
Cadvisor has been moved to Google artifacts repository. As we had trouble accessing that due to tight security in our organization we build it ourselves locally (that’s why you see that strange image name) and distribute it locally through our own docker repositories inside the organization. It was either that or run an outdated version from dockerhub (outdated by 4 years !!!!). But there’s no reason you wouldn’t have access to the normal repository and image: gcr.io/cadvisor/cadvisor. So replace the image with this in the docker-compose and give it a try or do what we did (no I won’t get into it, still not writing a book).
Again you can get a good idea at what is being ‘read’ from the host from the volumes section, and the fact that it runs as root (user parameter). Also the port used internally (8080) will probably give you trouble faster than you realize so again I have remapped it to something else (8082). You should really plan across your infrastructure for things like that and avoid exceptions.
Blackbox
Blackbox is a great exporter, it solves a lot of custom problems. The three areas I covered with Blackbox are mentioned in part-1: DNS, ICMP and HTTP checks (api and text). I will cover those in the Prometheus configuration run through. This block also has some entries you should take care with:
    dns_search: company.com
    domainname: company.com
    cap_add:
      - NET_RAW
Well those should be pretty much obvious, at least the first two (it’s like configuring part of the dns settings for a network interface in a host. What the third does is allow the appropriate access so you can send icmp packets from your container through the host’s network interface and get the replies back. So very important. I am sure you may be getting more ideas with this.. If you are interested, look up the cap_add (Capabilities Additional or Additional Capabilities if you are not Belgian or British in an Asterix comic book) entry for docker compose in here: https://docs.docker.com/reference/compose-file/services/#cap_add

Vmware Exporter
As previously mentioned in part-1, the vmware exporter is officially no longer being maintained. To be honest with this, the maintainer had not put out a new release in 3 years. Also, it works with our current environment. It’s probably a matter of time before it eventually stops working at some point. I don’t see it happening soon though. If it does, you can probably find a different way to get metrics into Prometheus, using the way Vmware Admins get data anyway (the official SDKs are coming and going but Powershell access remains, the last SDK I used was python based, I am sure something else is available as well, so either go with Push Gateway, or a custom exporter elsewhere, etc).
At any rate I am running the exporters locally on the Prometheus server and exporting data for each Vmware instance we have. I am displaying here how two different VCenter instances would be integrated into the project. As both instances are running on the same machine, their ports need to be remapped for them to be available (two different containers are needed for this). You can do your own plan and architecture here.
Again be mindful of how DNS settings are entered for these containers but also the DNS Servers themselves are declared:
    dns_search: company.com
    domainname: company.com
    dns:
      - 10.10.10.10
      - 10.10.10.11
Also, the credentials and URL to access vcenter instances are passed through environment variables. You could modify the config here, put the credentials in an external environment file and enter that instead in the docker-compose.yml. In that case you would probably also have to remember to exclude that file from the git repository as well by adding an entry to .gitignore . That would probably be best as the user may have limited access rights in VCenter but still, it’s a loose credential lying around. Yeah, I will probably do that too, sometime this week (probably already done by the time you read this).
Grafana
Wow are we finally there? Grafana is the largest section in this docker-compose file, mainly due to the many environment variables used. Why are we defining so much? In order to avoid having to update the grafana.ini all the time, by getting a current version for your Grafana version and modifying the appropriate settings to accommodate your environment. If you have all your custom settings in the environment variables, you can probably upgrade your Grafana version without sweating too much.
Do read the what’s new / changed sections in the releases though and look for breaking changes to anticipate problems (do I need to bring up backup/restore or at least snapshots for your hypervisor right before an upgrade? – You should probably keep a backup schedule anyway both for Prometheus and Grafana data).
What do we need to know here? We are mounting two files for configuration. You probably don’t need grafana.ini if you defined all the appropriate settings through the environment variables (be aware that there is a naming scheme for them according to the section in the grafana ini where those settings lie). But you do need the ldap.toml file as it contains important settings for your login to work with LDAP/AD.
We are also mounting the necessary certificates (be careful, the ssl folder is missing from the repo, you need to create it and populate it yourself) as we are serving https content and the users log here with their credentials so we can’t have those transported over the network without an encrypted connection.
We are finally making sure we get time and timezone synced from the host but Grafana operates in UTC and calculates times accordingly. This is the correct setting for us, it has been verified when using and troubleshooting mute timings.
What else is configured through environment variables? Config paths are important, the unified alerting setting was important for versions after 9 but since version 11 it is the only choice so perhaps not needed anymore, I just haven’t tested that. The GF_AUTH_LDAP_SKIP_ORG_ROLE_SYNC=true parameter is kind of important, it’s about syncing the role of the user according to what has been defined in ldap.toml for assigning roles through AD group membership. You could skip that but it’s a matter of choice (depends on whether you want that defined through AD membership or not).
Then there is a whole section for SMPT settings you need to configure correctly if you want to receive email alerts (I am guessing you do want that). Those are for MS-Exchange and work for our environment. You may have to tweek those to make it work for you. As a hint, GF_SMTP_FROM_NAME=GrafPrometheus may be important or not depending on your mail server environment but you should set it and test. Always test.
More on Grafana in the configuration section (we will mainly talk about ldap.toml there).
Alert Manager
I already told you, not dealing with it (we use the internal Grafana Alert Manager). If you do run it, you need those two mounts for the configuration file and the persistent data (to remain in case you destroy and recreate your containers or even upgrade the version by using a new image). The command options are used in accordance with the mounts to allow us to adjust the config and access data from outside the container. Similar issues with user access and content encryption with Prometheus (they are supposed to be closely connected with each other).
Securing coms (https and auth)
What do we need to provide security for data being scraped from the target systems? We need to configure the various exporters to serve content in https and use some kind of authentication to verify who is accessing the content.
Configuring HTTPS
This depends mainly on the exporter but it should not give you too much trouble. You will obviously need a certificate for the target system. In our case we had certificates created from our enterprise CA. Trust for the certificate is important on the Prometheus server side, so the CA chain needs to be available there and will be declared in the Prometheus configuration. So we modify the default exporter configuration on the target system to make the exporter serve data in https using the certificate we made and then we verify that certificate on the Prometheus server which acts like an http client in that case, accessing a web server.
Configuring authentication
Unfortunately you don’t have a great deal of choices here. The support for authentication in the exporters is usually basic authentication. You can usually hash the password inside the exporter config but it will be put in clear inside the Prometheus server config. At least it’s hidden if you access the configuration through the Prometheus server relevant page.
Can we really call this ‘security‘?
Not really. There is no one to blame for this. These systems are meant to run inside an architecture that will have to provide its own security implementation. If someone is operating from inside your virtual infrastructure or your container platform you have already done something wrong. Defining additional basic auth is just an additional precaution, it can’t be the basis of your security policy. So limiting access, using firewalls or access lists or additional systems, monitoring logs etc is what you should probably already be doing to insure the integrity and confidentiality of your systems and information. We are not really covering security here, it’s the absolutely minimal effort you need to make on the platform level.
There are ways to leverage other platforms for secrets management for example Hashicorp Vault. However I feel that for now this would just over-complicate things. Maybe in the future.
Node Exporter configuration example
Let’s see an example for Node Exporter, similar configuration can be used for Windows Exporter or other exporters (always look for official documentation on those before following blog posts). The github repository for Node Exporter contains most options and even refers to the textfile collector. It makes a reference for TLS configuration and points to this: https://github.com/prometheus/exporter-toolkit/blob/master/docs/web-configuration.md .
After you are done looking there you can read these:
- https://dev.to/cod3mason/securing-node-exporter-metrics-2ome
- https://medium.com/@abdullah.eid.2604/prometheus-node-exporter-security-9118f65a9f59
The first post contains instructions to use docker compose to run Node Exporter as a service, very similar to what we have in the repo. But we don’t include any config file in ours. So what would that look like? Exactly as the post shows. It offers a python script to generate a hash of the password. After you get that either through the script or or a different way, you need to define the config in a file in your docker host with these contents (replace user and password hash):
tls_server_config:
  cert_file: /etc/node_exporter/node_exporter.crt
  key_file: /etc/node_exporter/node_exporter.key
basic_auth_users:
  <USER>: <HASHED-PASSWD>
That file has of course to be mounted inside the container which happens due to this entry in the volumes section (it supposes there is a configs subfolder under the docker compose project):
- ./configs:/etc/node_exporter:rocoupled with this entry in the commands section:
- '--web.config.file=/etc/node_exporter/config.yml'Here is the whole docker-compose file, compare it to what we have in the repo for the node exporter service:
services:
  node-exporter:
    image: prom/node-exporter:latest
    container_name: node-exporter
    restart: unless-stopped
    volumes:
      - /proc:/host/proc:ro
      - /sys:/host/sys:ro
      - /:/rootfs:ro
      - ./configs:/etc/node_exporter:ro
    command:
      - '--path.procfs=/host/proc'
      - '--path.rootfs=/rootfs'
      - '--path.sysfs=/host/sys'
      - '--collector.filesystem.mount-points-exclude=^/(sys|proc|dev|host|etc)($$|/)'
      - '--web.config.file=/etc/node_exporter/config.yml'
    ports:
      - 9100:9100
The second post describes how to set things up as a service in the host os (no docker containers) in the target system. However don’t forget Medium is limiting access to some post, so you may need to search for the same information elsewhere, if you don’t have access to that already.
Making sure everything fits together
It’s very important to understand from the start that you should view your project backwards: Finish to Start.
What do we want? We want teams of admins to have access to visualizations of data for status and performance and be alerted when things go wrong. How do we make sure they get access to the relevant data and resources that they should get access to, how alerts are routed properly to the right teams, how each team will only get access to their data and not the data of other teams, how do we get access to silences, etc.
If we do that from the beginning, then the plan becomes clear. We need separation, access rights, correct groupings and a label strategy. I bring this up in the final paragraph (with a twist). But it’s important to understand that this is one big project, not a unification of smaller ones. You need to make the right decisions in all places, make sure values and structure much across systems and components.
That starts from setting the correct parameters in your server config what match the ones used at the target systems and making sure mounts relate to files referenced in configurations and command options and goes on to make sure your labeling strategy defined for your data separation matches your alerting rules and goes on to match your notification policies and your mute timings.
You can either take that into consideration from the beginning and design your architecture accordingly, or do iterations of bad decisions and go back to correct them once you realize where your mistakes surface and come back to bite you. Let’s be honest: Unless you carry a lot of experience in this (I don’t see why you would still be reading this in that case, but if you are indeed here, thank you for your patience), you will most likely fail and start over or at least go back a few steps.
Configurations
Except what is indirectly configured through command options and environment variables in the docker-compose.yml file, there are configuration sections in dedicated files that are mounted in the containers. We take a look at most of those below.
Prometheus
alert.yml
The core of your system needs two files as we mentioned earlier. Let’s start with what is the least useful in our setup, the alert.yml file inside Prometheus, which is in YAML format (obviously). As I mentioned already, we don’t choose to define alerts inside the Prometheus instance, we do that in Grafana. If we didn’t, here is where you would create all your alerts and then Alert Manager would take care of ‘routing’ them. In our case the file contents are very basic:
groups:
  - name: NodeLocalAlerts
    rules:
      - alert: LocalInstanceDown
        expr: up{job="node_local"} < 1
        #expr: -1
        for: 1m
        labels:
          severity: 'critical'
          service: 'LocalInstanceDown'
This sets up a very basic alert for the local instance so that you can basically check whether Prometheus works. If the Prometheus system is not up (as the alert rule implies) then the whole query fails, you don’t get a response that would result in the conclusion that the system is down. You don’t get a response at all. What would happen in this case? Grafana would alert us for a datasource that is not responding (no data). Still an alert but not this one and it’s often handled differently due to the lack of labels that would help in its routing (in Grafana it’s routed to the default contact point). If Prometheus does work it will show the state of that alert as non firing.
prometheus.yml
Let’s go on to the basic configuration file, prometheus.yml, which is obviously also in YAML format. You can find a link to the configuration reference in the Prometheus documentation here: https://prometheus.io/docs/prometheus/latest/configuration/configuration/.
A valid example of a configuration file can be found here: https://github.com/prometheus/prometheus/blob/release-3.7/config/testdata/conf.good.yml
The first section is global: which contains the global parameters, those that are inherited for every target unless specifically overwritten in their own section. In our case we define the scrape interval and timeout (how often we scrape and after how much waiting time we consider that the target did not respond if we don’t have an answer).
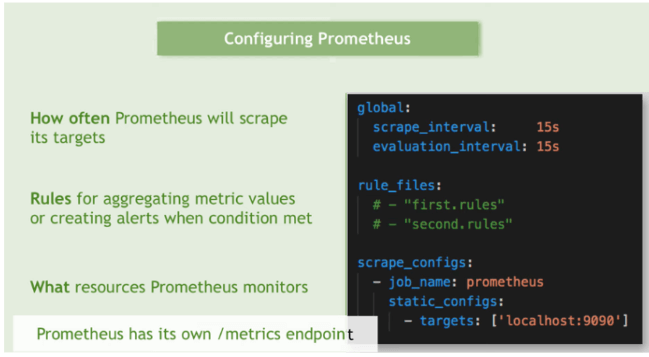
The next section is where we define the alert rules file reference (rule_files:), followed by the section where we define the alert manager for our instance (alerting: and alertmanagers:). In the original architecture these two components go together and reference each other. Here they are two services in the same docker compose project, sharing the same bridge but the alert manager carries only a skeletal configuration so that the reference is there and works but carries no real meaning or use case.
The scrape_configs: section is where the real fun begins. In there we define our targets as groups, configured as jobs (scraping jobs). Each job carries a group of settings that are common for the targets it references (targets are also referred to as instances). Here is where we first come in real contact with how targets are defined in Prometheus. The simplest way is to define a list of statically configured targets.
That starts with static_configs: right after the job name, and continues to define targets with - targets: with the dash in front implying a yaml list (that means you can probably have more entries for groups of targets there, each with their own unique combination of values). Following that comes an array of targets inside brackets ['','','', ...] where for each target we define a hostname or ip address along with a service port preceded by a colon (:). That port usually references a particular exporter on that target (multiple exporters may be running on the same target as services, for example a node exporter, a process exporter and a cadvisor).
- job_name: node_local
  static_configs:
  - targets: ['nodeexporter:9100']
    labels:
      exporter_type: 'node'
      server_group: 'local'
      team: 'adminonly'
      environment: 'prod'
Every job can contain targets for a specific exporter type, or it can contain targets of different types but in that case it would make sense to group in target list entries (that’s where that yaml list comes in with the dash in front of each entry of ‘targets:’).
After that we get a labels: section, where a common set of labels is set for that group of targets along with the label values. It would probably be wise to dedicate a separate paragraph on that, right after this one… or rather after the next one.
You may have noticed already that in some cases there is no static_configs: entry but in its place lies a file_sd_configs: entry. That means that the targets for that job are not statically defined inside the relevant block in the prometheus.yml file but in an external file defined in that section, implying a ‘dynamic’ connection to that config section (in the sense that it is not statically included in the main config file, I know kind of confusing, it’s still another file).
Usually that file is in JSON format which very convenient as you will see in a minute. One thing to keep in mind though, is that there are configuration options that can not be defined in an external file but are only available as configuration options in the main Prometheus yaml-based config. So what does SD stand for?

SD, as in Service Discovery
Maybe it’s a good time to talk to you about Service Discovery. This refers to Prometheus capability to be able to define targets semi-dynamically or fully dynamically. A semi-dynamic way is to declare an external file as a source for the targets, like below.
- job_name: admins0005_linux_servers
  scrape_interval: 1m
  file_sd_configs:
  - files:
    - 'admins0005_linux_servers_targets.json'
This allows for several job parameters to be set up in that external file (with JSON format in this case). Let’s see at how that could look like (I made our relevant file in the repository a little shorter):
[
    {
        "labels": {
            "exporter_type": "node",
            "server_group": "0005_linux_servers",
            "team": "admins0005",
            "environment": "prod"
        },
        "targets": [
            "srv-0005linux-03:9100",
            "srv-0005linux-04:9100"
        ]
    },
    {
        "labels": {
            "exporter_type": "process",
            "server_group": "0005_linux_servers",
            "team": "admins0005",
            "environment": "prod"
        },
        "targets": [
            "srv-0005linux-03:9256",
            "srv-0005linux-04:9256"
        ]
    }
]
So we are seeing grouping of targets/instances of the same exporter type but I could be having different groups in case I needed to have different label values per group (for example server_group values or environment values – like prod/test/uat/drs).
Fully dynamic service discovery is possible either through DNS using SRV records or A records that point to multiple hosts (in that case the port will be the same for all and set in the prometheus configuration as DNS can not store the port number with the records) or via using an API as with Kubernetes. In our project we only go as far as defining file sd configs in certain cases, but that may very well change in the future.
(Prometheus) Labels
I can feel my alter ego itching to surface and shout “What the heck are those labels you keep yapping about?”
Labels are a wonderful invention. They are sweet as pie. They are arbitrary tags carried with the data.
We ‘label’ the data in various paths of the data creation and forwarding path in our infrastructure so that we can more easily filter it and get to what we want. They are acting as index aids in such databases as TSDBs – Prometheus is a TSDB, Time Series DataBase – so that the filtering works as fast as possible.
As it happens with good ideas, labels are not limited to Prometheus. More tools support tagging data with labels (e.g. Telegfraf) and more DBs support them as well (e.g. InfluxDB) but also more systems can read and use them (e.g. Grafana!! Yey!!!).
Labels do bring up the issue of cardinality though, which is the measure of the ability of a TSDB to carry so many different values of tags before it eventually becomes unable to perform its functions well, as the different label values combinations would need more and more indexing and in the end our DB becomes paralyzed, too heavy and too slow for our infrastructure. That can also happen by accident as I described in my post ‘How to clean up tags in your malfunctioning TIG stack for SNMP monitoring – or chasing runaway tags with InfluxQL, grep and a Python script‘. Cardinality is such an issue that it has led DB creators to pursue different directions on architecture and filesystems (like Apache Arrow and Apache Parquet) so they can claim to be fast no matter what and to achieve ‘Unlimited Cardinality‘. What should you do?

Stay calm. Try to use as few labels as possible and as few different values as possible. Don’t create new combinations without a serious reason. If you are gathering data that come from different teams of admins, each team may have their own set of values. Sit down, talk to them, get to a common understanding about what should be done with this. Also, try to solve issues the right way. If you are tempted to create a tag because the syntax for an alert becomes too difficult, think it through, do your research and if there’s really no alternative, ok go ahead and do it.
And size your systems adequately. I think that’s a good starting point.
So .. about the labels themselves… You can define labels to differentiate and categorize your data according to your needs. For example a label named ‘team’ can give you the ability to separate and categorize the data per admin team responsible for a number of systems and services and later on, route your alerts to that team’s contacts and define your access rights for that team members (remember what I said earlier about going backwards).
Some labels come with the data. You didn’t set them up. The exporter did (e.g. ‘hostname‘). Others are created by Prometheus (e.g. ‘instance‘). There are a lot of things to learn about labels. They are created and modified in three stages in the data lifecycle with Prometheus, at the target, during scraping and when processed by Prometheus where they can also be replaced or even dropped (another way to decrease the number of unwanted labels if that’s needed). One thing to also know about labels is they play a big role in the alerting stage, not only in the creation of optimized alert rules but also they can be maintained or dropped via a promql querie in an alert rule and that will leave you hanging later when you need to use fields in templates for your alert messages. So learn to love them and learn more about them.
To know more about labels take a look here:
- https://prometheus.io/docs/concepts/data_model/#metric-names-and-labels
- https://www.ibm.com/docs/en/webmethods-integration/wm-integration-server/11.1.0?topic=metrics-prometheus-labels
- https://iximiuz.com/en/posts/prometheus-metrics-labels-time-series/
- https://grafana.com/blog/2022/03/21/how-relabeling-in-prometheus-works/
Windows Exporter targets
Below is an example of a job corresponding to windows exporter targets, configured with https and basic authentication. Notice the tls_config: entry where the ca chain certificate path is mentioned.
- job_name: admins0009_windows_servers_winexporter
  scrape_interval: 2m
  scheme: https
  basic_auth:
    username: "prometheus"
    password: "prometheus_password"
  tls_config:
    ca_file: /etc/secrets/ca.cer
  file_sd_configs:
  - files:
    - 'admins0009_windows_servers_targets.json'
Blackbox exporter targets
Of course once you are done with node exporter or windows exporter targets, whether they come with encryption or not (see code example below), and even go past the vmware exporter targets section (not a lot, is it? Just 4 lines), you eventually get to the an interesting piece of work..
What do I mean? The Blackbox exporter target section of course.. What a piece of art!
Yes I am joking. It gave me so much trouble this one. The blackbox exporter capabilities come in several flavors or probes or modules (I get confused with their terminology). We used the DNS probe, the ICMP probe and the HTTP probe, with that last one getting two distinctive use cases: check a web page for text (to alert for deface as well as whether the site is up and how fast it is responding etc) and check an http api (e.g. REST endpoint) for a response.
Every one of those probes returned results that had label values totally different than what we wanted. For example the DNS probe essentially tests DNS servers. But we didn’t want to test the DNS server itself, just whether the record of our target system is being resolved and with what parameters (yes you can have performance values as well if you want them). Similar issues happened with the other probes. That required us to do some ‘relabeling’, meaning to change label names and/or values, depending on what we needed. It’s not an easy subject and I won’t pretend to understand all of it, but we ended up with what we wanted. It’s all about correlating our result values with the real target in question. You will see a lot of regex matching for the replacements and there are comments to help you (and me when I forget). Either give me a shout to help you understand or pray to the gods for help. Good luck!
Grafana
The most important stuff you need to configure for Grafana to operate correctly are already declared in those environment variables we saw earlier that essentially are there to override the defaults in grafana.ini. Some of the options they affect are available inside the Grafana admin section (settings). Others like for example the server URL and the content type are required for operation.
The file that is left is ldap.toml as mentioned already and that plays a great deal to allow for Grafana to authenticate users via LDAP (and Active Directory in this case). An example of that file is also included in the rest repo so I will discuss the most important settings but keep in mind that if you replace with your own values and things don’t work, you will require some troubleshooting so you will need access to logs on both sides (at least your Grafana instance logs but a fellow AD admin could help).
Someone must also provide the correct settings if you don’t have access to the AD itself.
So, lets take a look:
Host, port and use_ssl
Those are almost self explanatory. We use ldaps in our case and we declare two different ldaps hosts for redundancy.
ssl_skip_verify
Set this to true if you don’t want to mess with validating the server certificates. If you are doing that already, be my guest and set it to false (I am not expecting someone to replace our AD hosts and use malevolent systems instead to capture your credentials without getting access to our CA chain certificate which is already in the same system, but knock yourself out).
search_filter
How you search for users (field mapping). Check to see what works.
servers.attributes
Those are important with the most important ones being username and mail. They allow the correct fields to be identified so the user can be searched and group membership can be checked (if you are using that).
search_base_dns
Where do we look for your users?
servers.group_mappings – multiple ones
This is where we define organization level roles when the sync we discussed earlier is in use.
Where to look for more info
If you need to know more about Grafana configuration, start at the configuration reference here: https://grafana.com/docs/grafana/latest/setup-grafana/configure-grafana
Exporters
Process exporter
The exporter related configuration on the server is mainly about configuring the components that will provide monitoring info for the server and the components themselves. So node exporter, process exporter and cadvisor (as we are running Prometheus on Docker on a Linux host). Unless you want to serve https content inside the same docker bridge, the only additional file you have to provide is the process-exporter.yml in the process_exporter folder:
process_names:
  - name: "{{.Comm}}"
    cmdline:
      - '.+'
Nothing significant there. If you want to know more about configuring process exporter, take a look here:
https://github.com/ncabatoff/process-exporter
There is one more thing we need to take care of to complete the configuration walkthrough.
Blackbox
The blackbox exporter needs more configuration about modules. So we need to add the blackbox.yml file inside the blackbox folder so that the config file is mounted inside the container and used for configuration (same deal here: volume section entries <=> command section entries).
The configuration is broken into modules. Those modules are referenced in the blackbox targets configuration for Prometheus.
DNS is the default module so in that case there is no module parameter in the Prometheus config, however for each FQDN to be resolved, it’s necessary to declare a separate module in the Blackbox config with that FQDN. The value before the dns server in the target entries in the Prometheus configuration, e.g. server2.company.com in the line: server2.company.com:10.10.10.10, needs to be the name of the corresponding module in the Blackbox configuration. In the config for that module several specific and hardcoded parameters are included, thus creating the need for a separate module instead of supplying all the parameters in the Prometheus config.
The config for http probes is similar, needing different modules as some parameters are hard-coded, like the valid status codes and the text to be searched and matched via regex.
Only the icmp_ipv4 module is independent of the targets as there are no target specific parameters to be hardcoded per module in the Blackbox config.
More about the Blackbox exporter here:
- https://github.com/prometheus/blackbox_exporter
- https://grafana.com/docs/agent/latest/static/configuration/integrations/blackbox-config/
- https://www.opsramp.com/guides/prometheus-monitoring/prometheus-blackbox-exporter/
- https://prometheus.io/docs/guides/multi-target-exporter/
- https://www.stackhero.io/en-US/services/Prometheus/documentations/Blackbox-Exporter/Prometheus-Blackbox-Exporter-configuration
- https://medium.com/@squadcast/prometheus-blackbox-exporter-a-guide-for-monitoring-external-systems-a8fff19a8bd0
Remote Target configurations
What is usually run at the target side? Well there are a lot of possibilities for exporters as we have already seen in part-1, but I will link to the relevant page here as well: https://prometheus.io/docs/instrumenting/exporters/
What happens is mostly dictated by which are the components of a service. Several questions can help there in order to determine what exporter is needed and in turn what the configuration would be:
- What is the underlying system? Is it a native service (on top of an operating system) or a micro-service?
- If it’s a micro-service, is it run on Docker or Kubernetes? What is the underlying operating system for each of those cases?
- Does the service itself have an exporter endpoint or not? A lot of software services support Prometheus metrics on their own.
- Are there custom metrics? If yes how are they integrated? Is a local exporter enriched or do we get the metrics from push gateway?
In most cases, if the underlying operating system is Linux, we need to configure node exporter and process exporter. If it’s windows, then windows exporter.
If we are running a Docker host then we also need cadvisor. That is probably true also for kubernetes clusters.
You already have all you need for a minimal docker on linux install for linux servers with docker compose (3 services as mentioned, under /opt/prometheus-docker). If needed you can also use a certificate to enable https and basic auth for the node and process exporter services. The github repository contains an example in the linux_targets folder here, along with a small description here. Unfortunately the cadvisor container does not support security features by choice, as mentioned in this issue here, so your only choice for tls support with it, is using a reverse proxy (link Nginx or Caddy), as it is described in this blog post. Below you will find the file and folder structure for this:
.
├── docker-compose.yml
├── node_exporter
│   └── web_config.yml
├── process_exporter
│   └── process-exporter.yml
├── readme_node_exporter.md
└── ssl
Similarly for windows exporter, you can install it as a software service (I use the msi installer but be careful as there are software dependencies and maybe you need to find what is the right version for your windows system) and can be configured to use a web config to enable https and basic authentication as well (it’s practically the same config as with node exporter, but different options at the command line). The github repository contains an example in the windows_exporter folder here, along with a small description here.
Popular software service exporters are:
- Springboot exporter: https://grafana.com/docs/grafana-cloud/knowledge-graph/enable-prom-metrics-collection/application-frameworks/springboot/
- Kafka exporter: https://github.com/danielqsj/kafka_exporter
But you can often find custom software exporter use cases for example:
- Cisco DNAC (now Catalyst Center) Exporter: https://developer.cisco.com/codeexchange/github/repo/CiscoDevNet/DNACPrometheusExporter/
- Nautobot Exporter: https://docs.nautobot.com/projects/core/en/stable/user-guide/administration/guides/prometheus-metrics/
- Gitlab Exporter: https://docs.gitlab.com/administration/monitoring/prometheus/gitlab_exporter/
Also don’t forget you can create your own: https://prometheus.io/docs/instrumenting/writing_exporters/
Choosing your targets grouping and labeling strategies in Prometheus
No so fast.. Time to remind everyone we are not writing a book.. This subject deserves to be developed so it will be developed in part-3 of this series, under the tittle: Part-3, Choose your Prayers Wisely.
Are we forgetting something? What about Grafana Dashboards and Alerts? And notification policies? As those are Grafana resources and we will be provisioning Grafana resources with Terraform, all those will be discussed in part-4 of this series, under the tittle: Part-4, The Three Days Miracle.
Thank you for your patience so far, see you in part 3 and 4. As always, if you run into trouble or have questions, reach me on Twitter under the handle @mythryll.